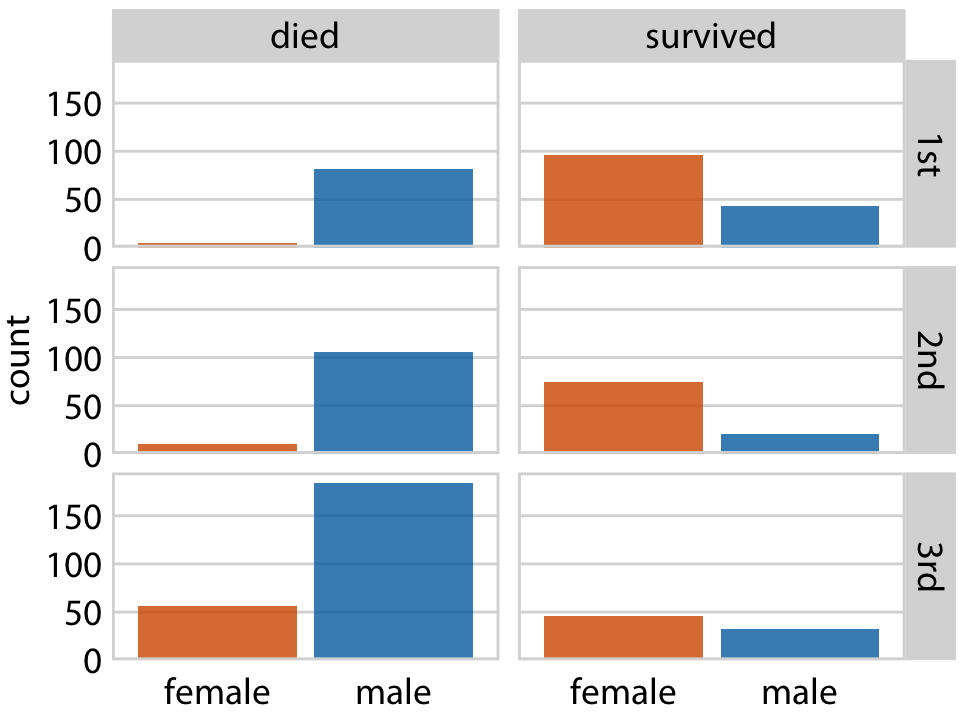
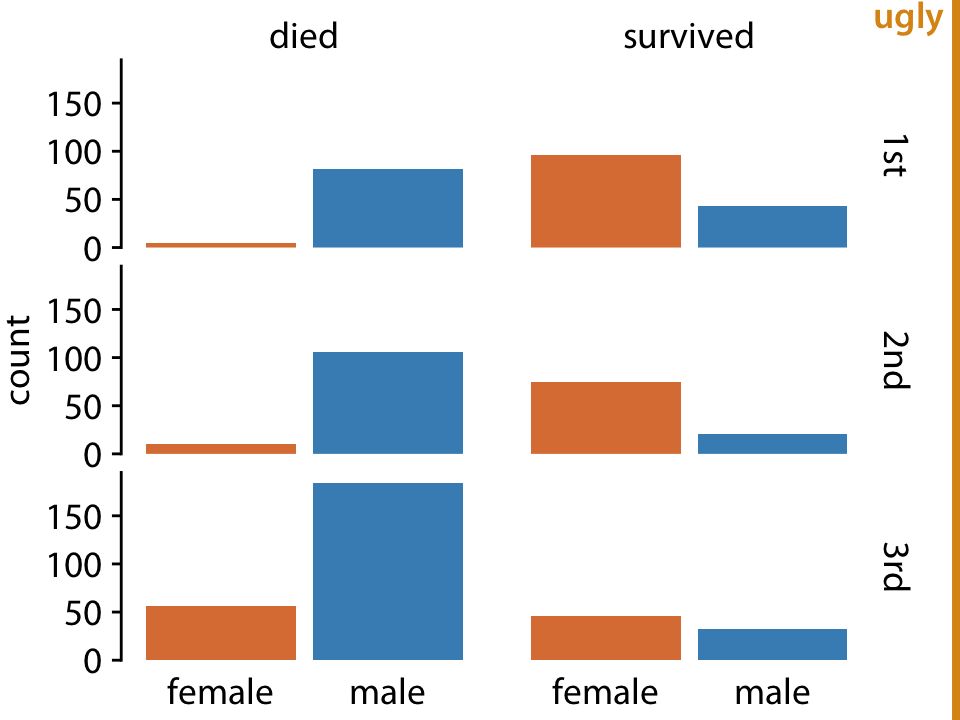
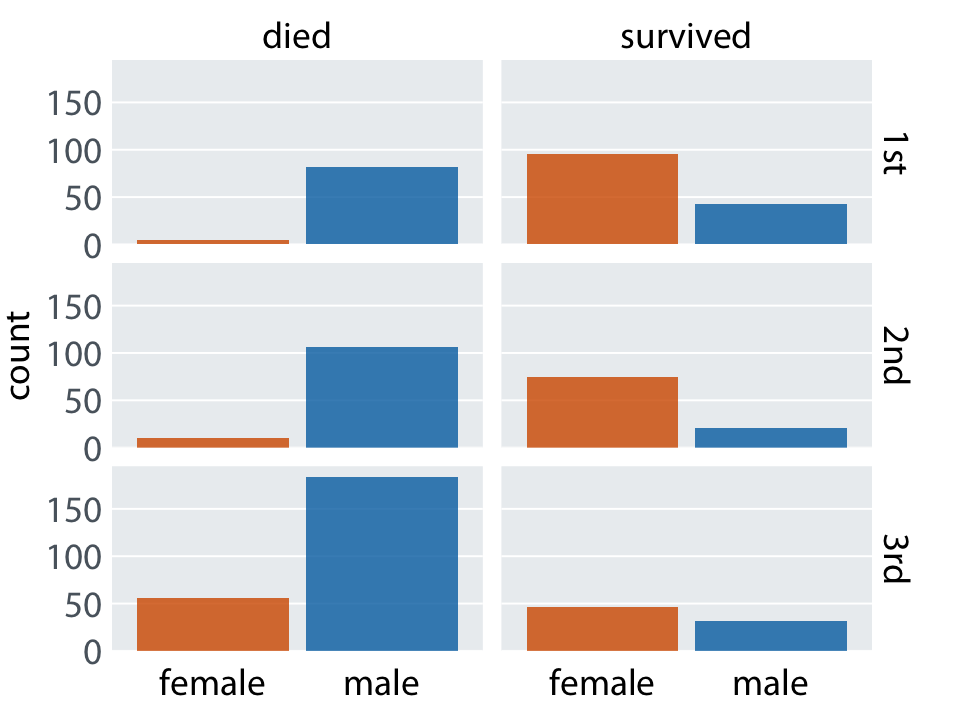
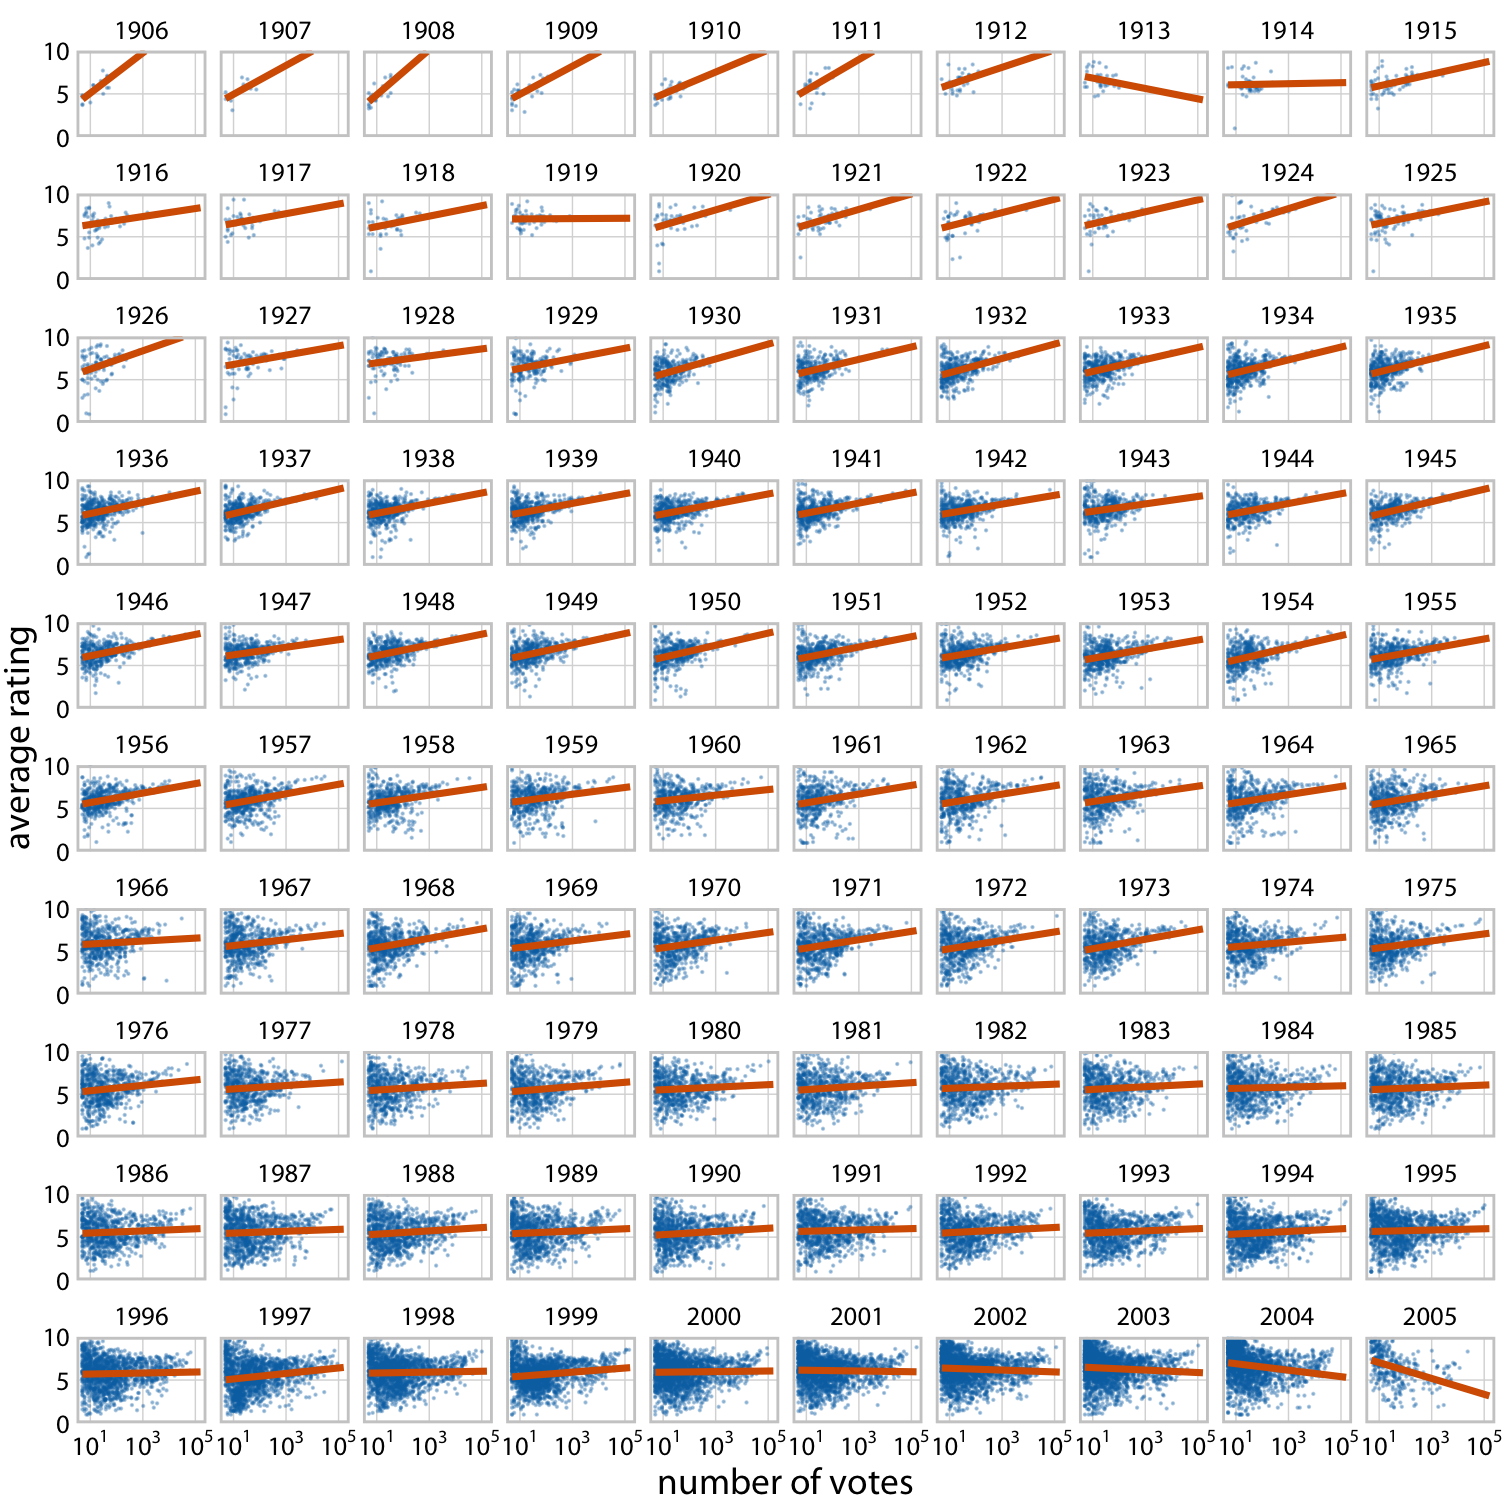
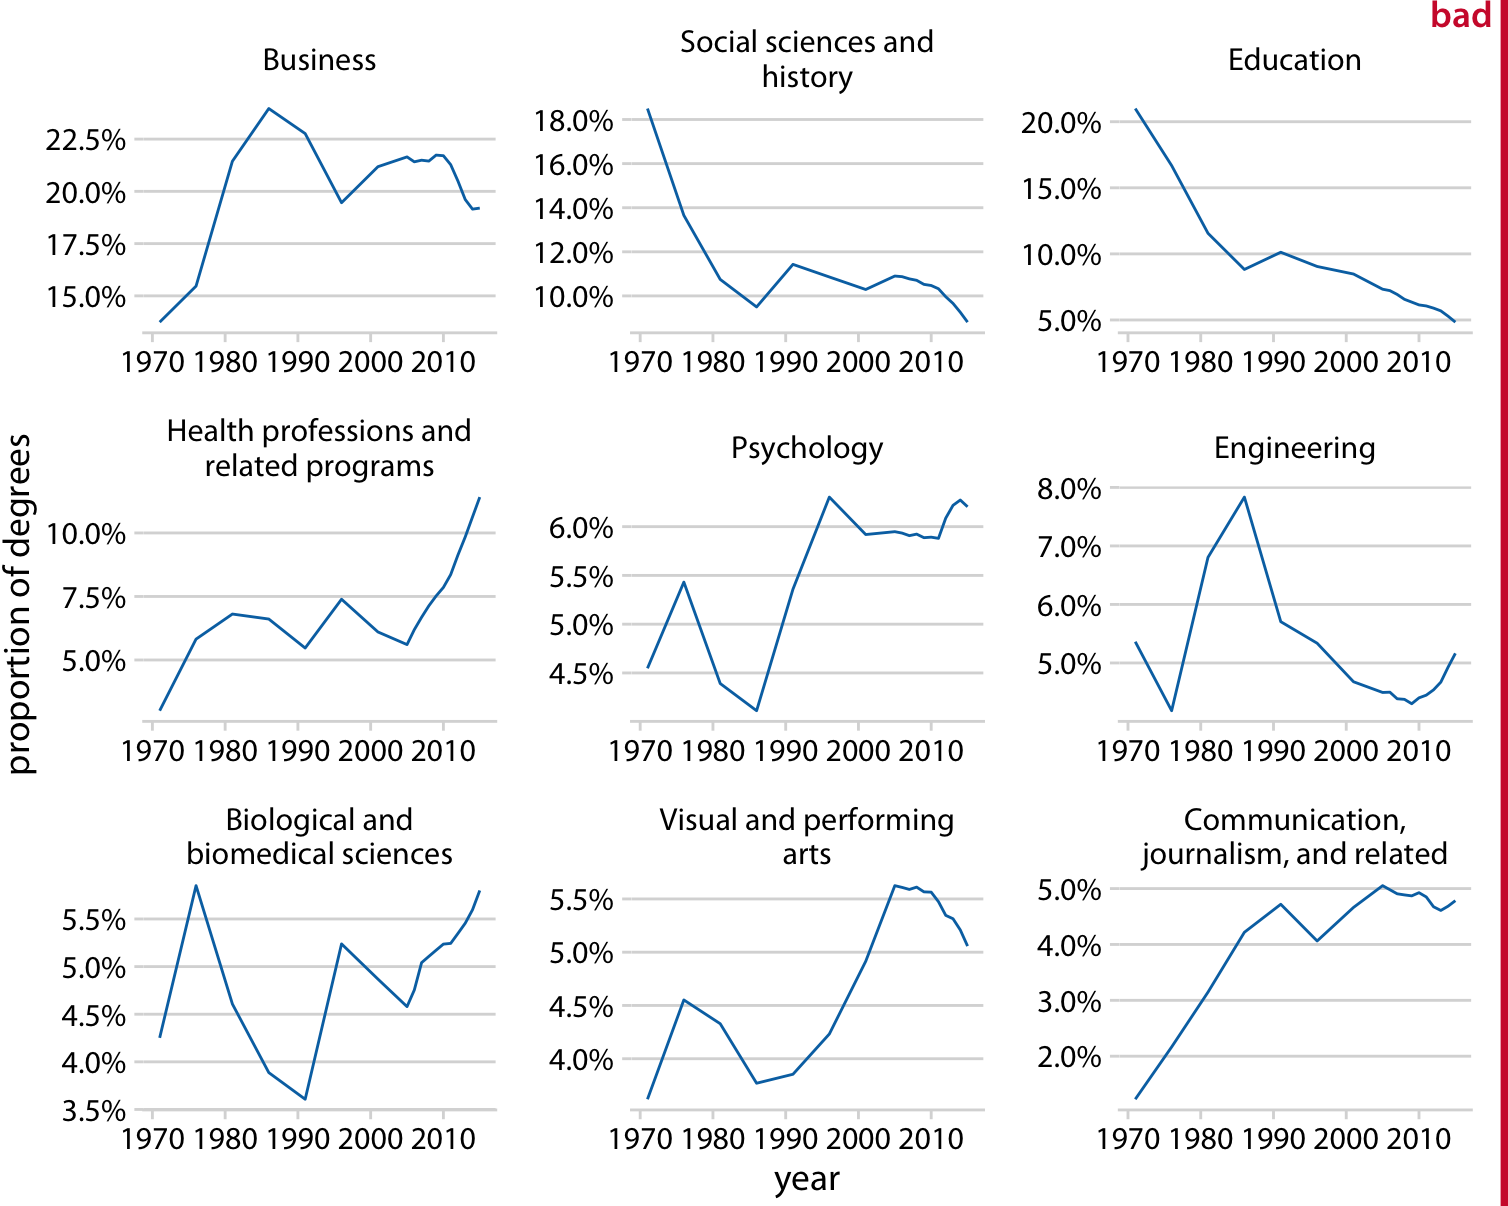
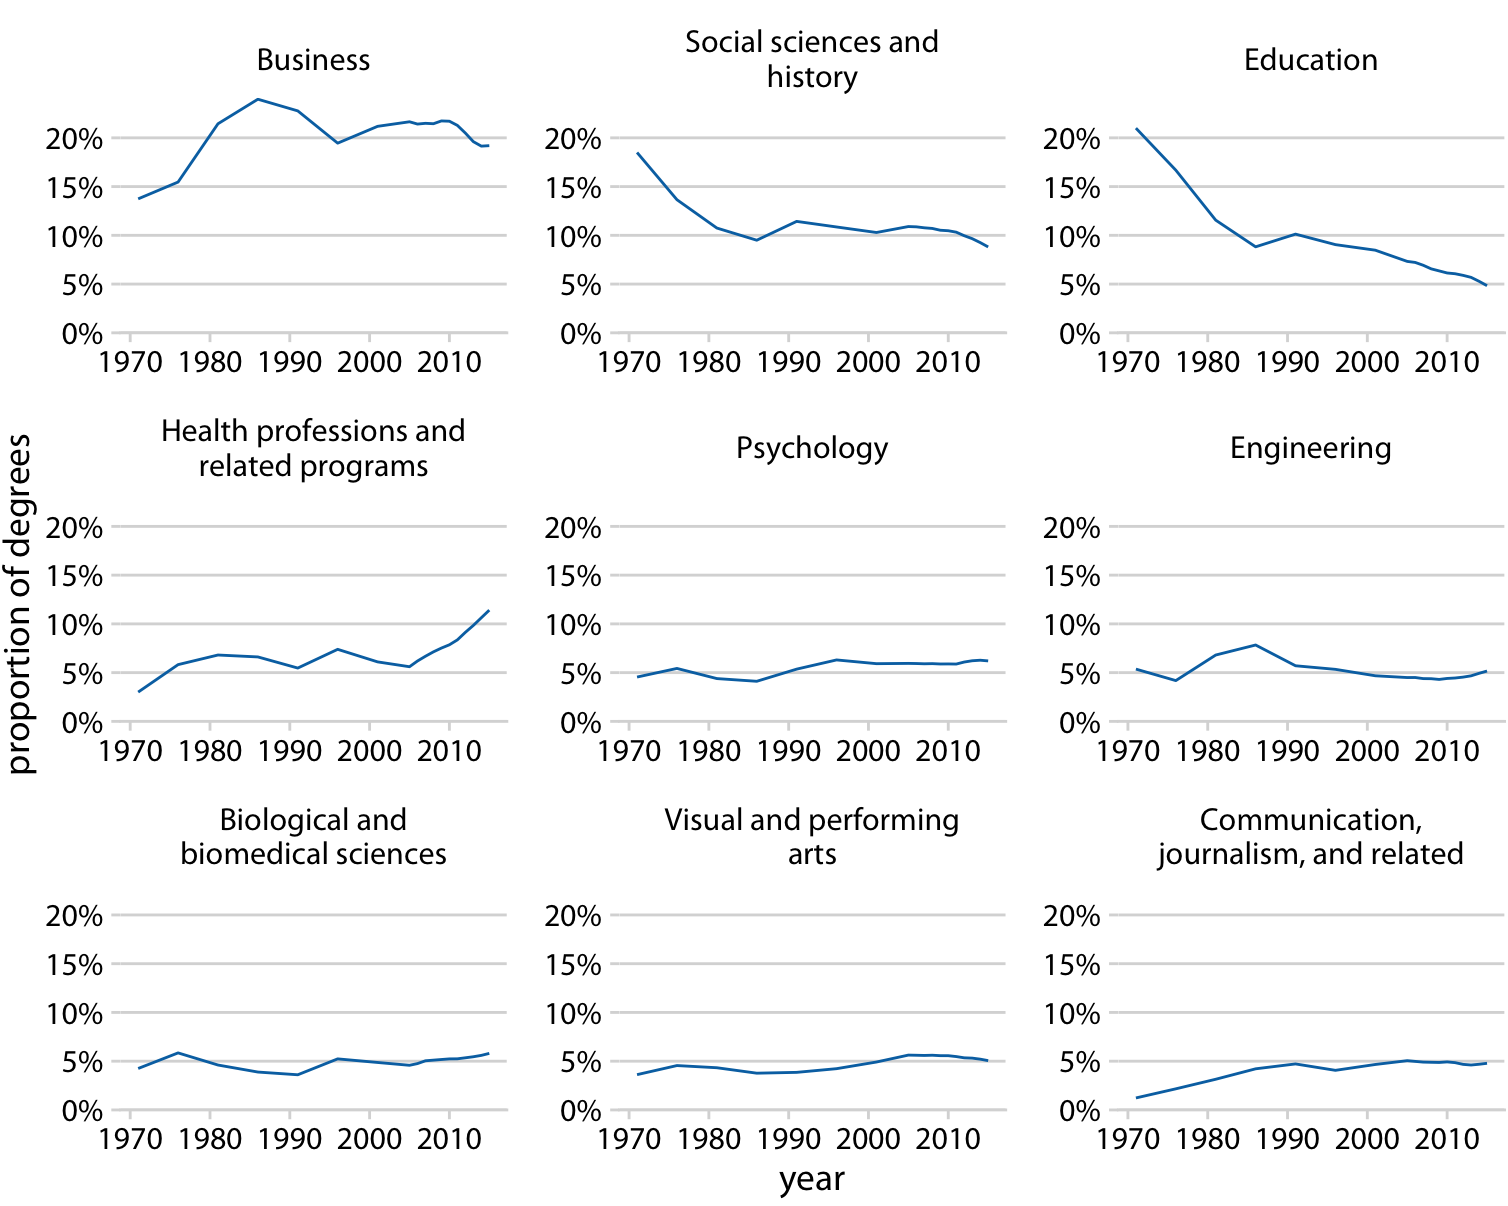
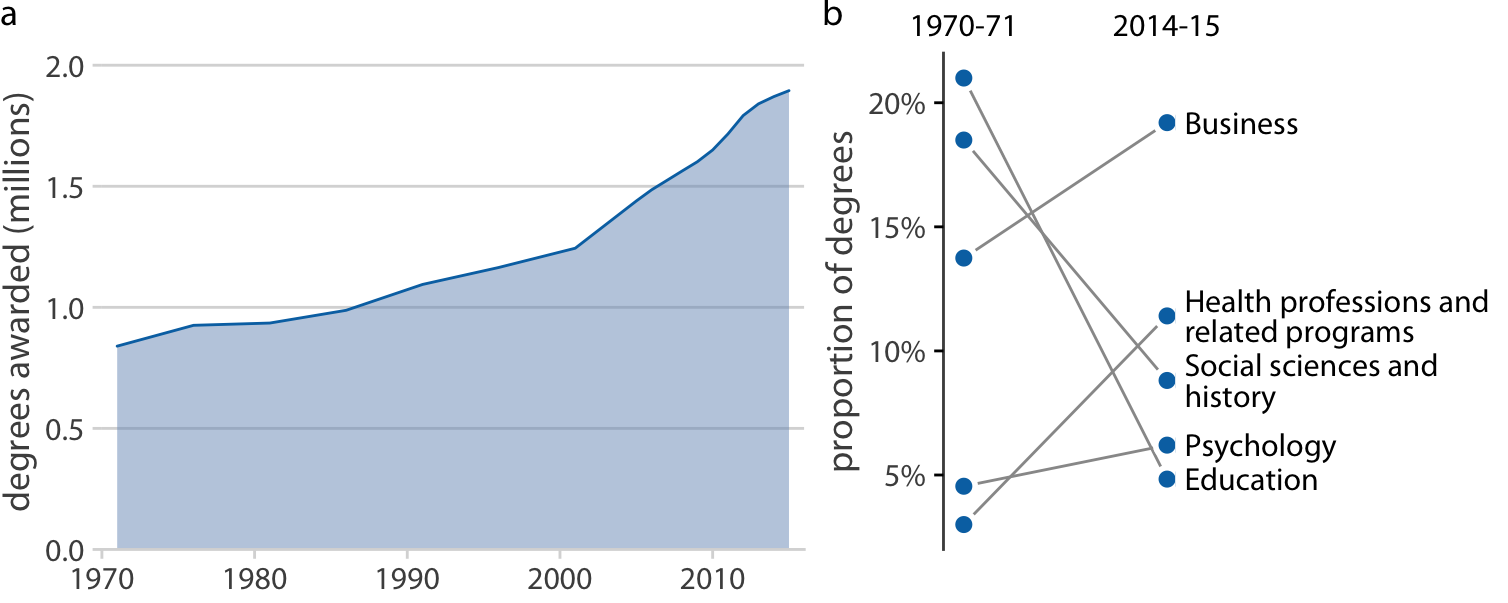
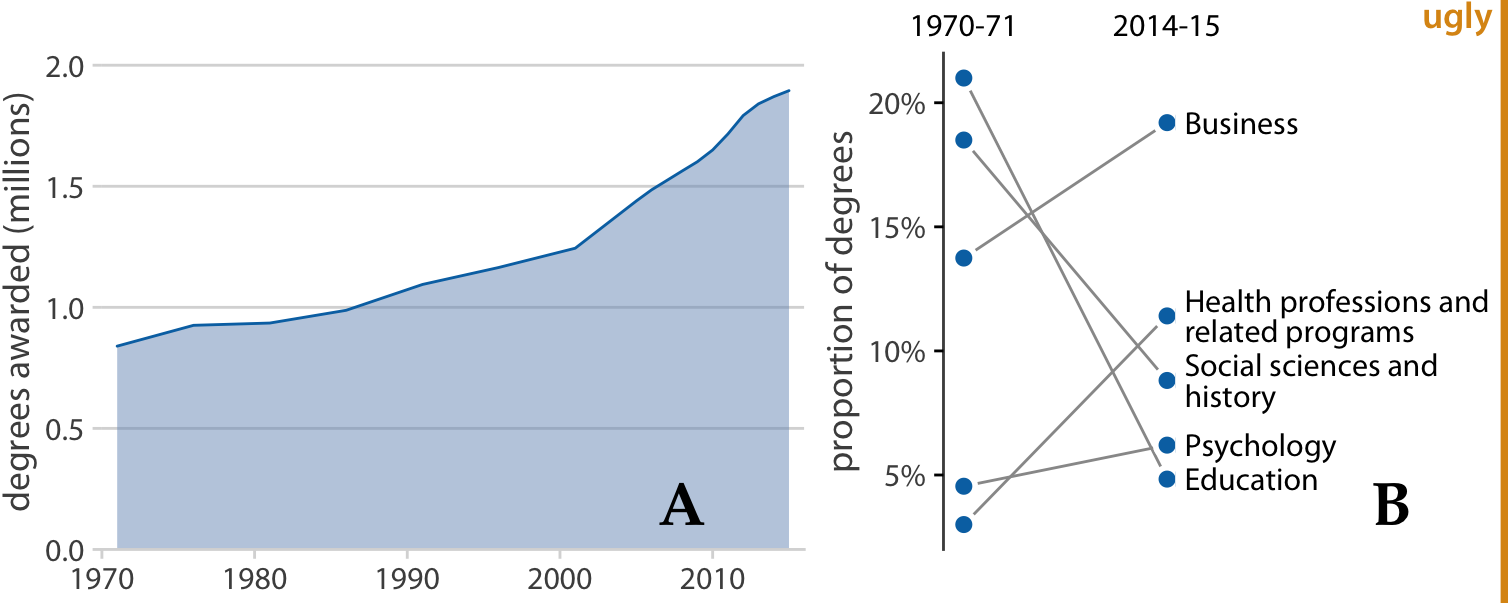
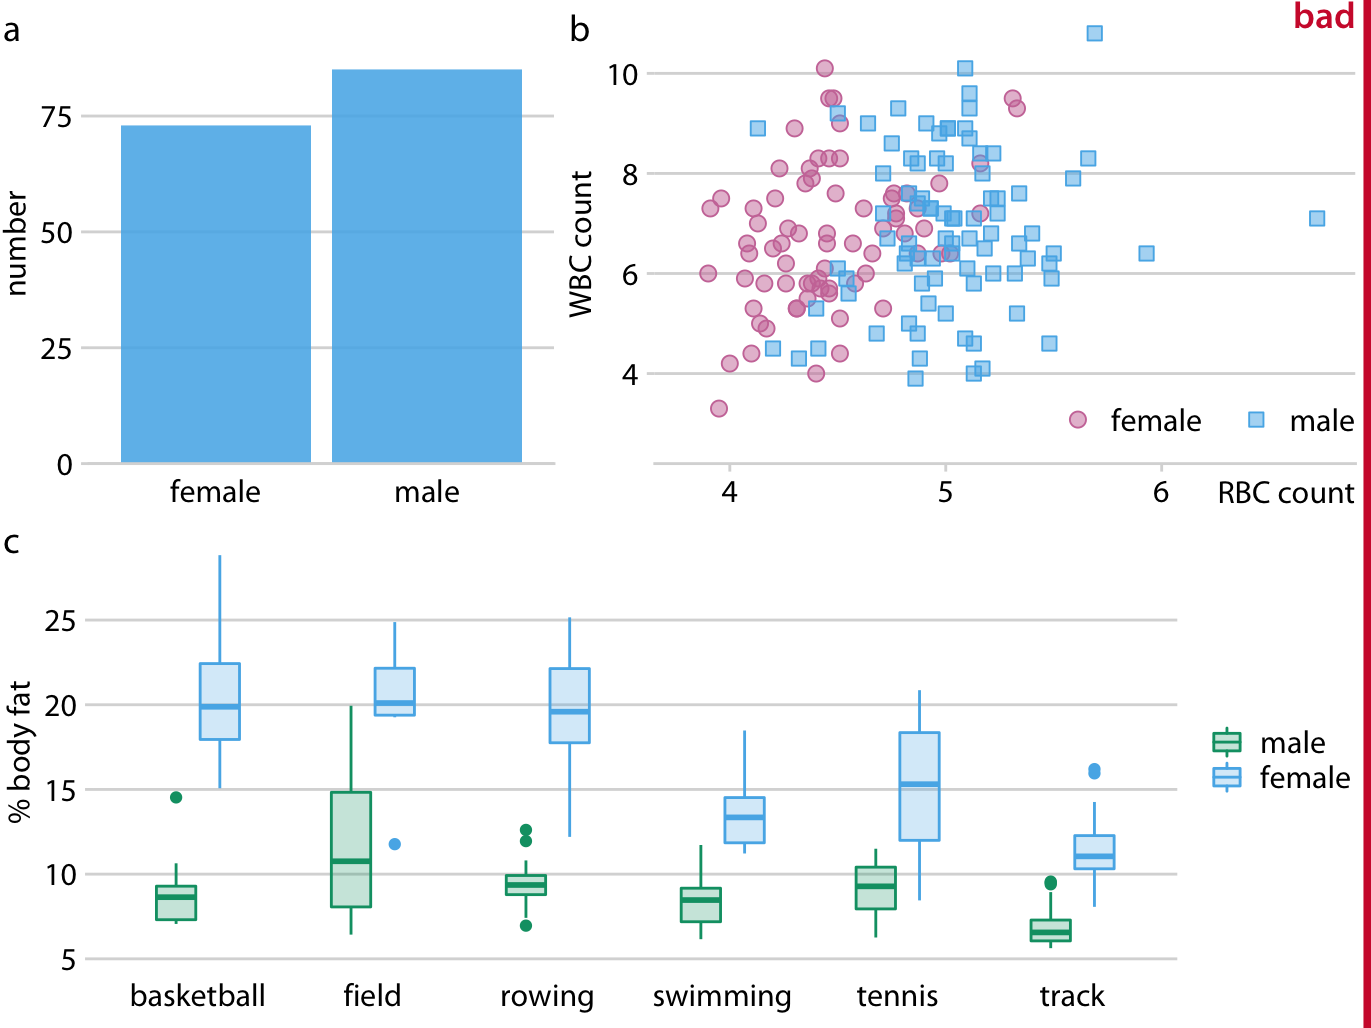
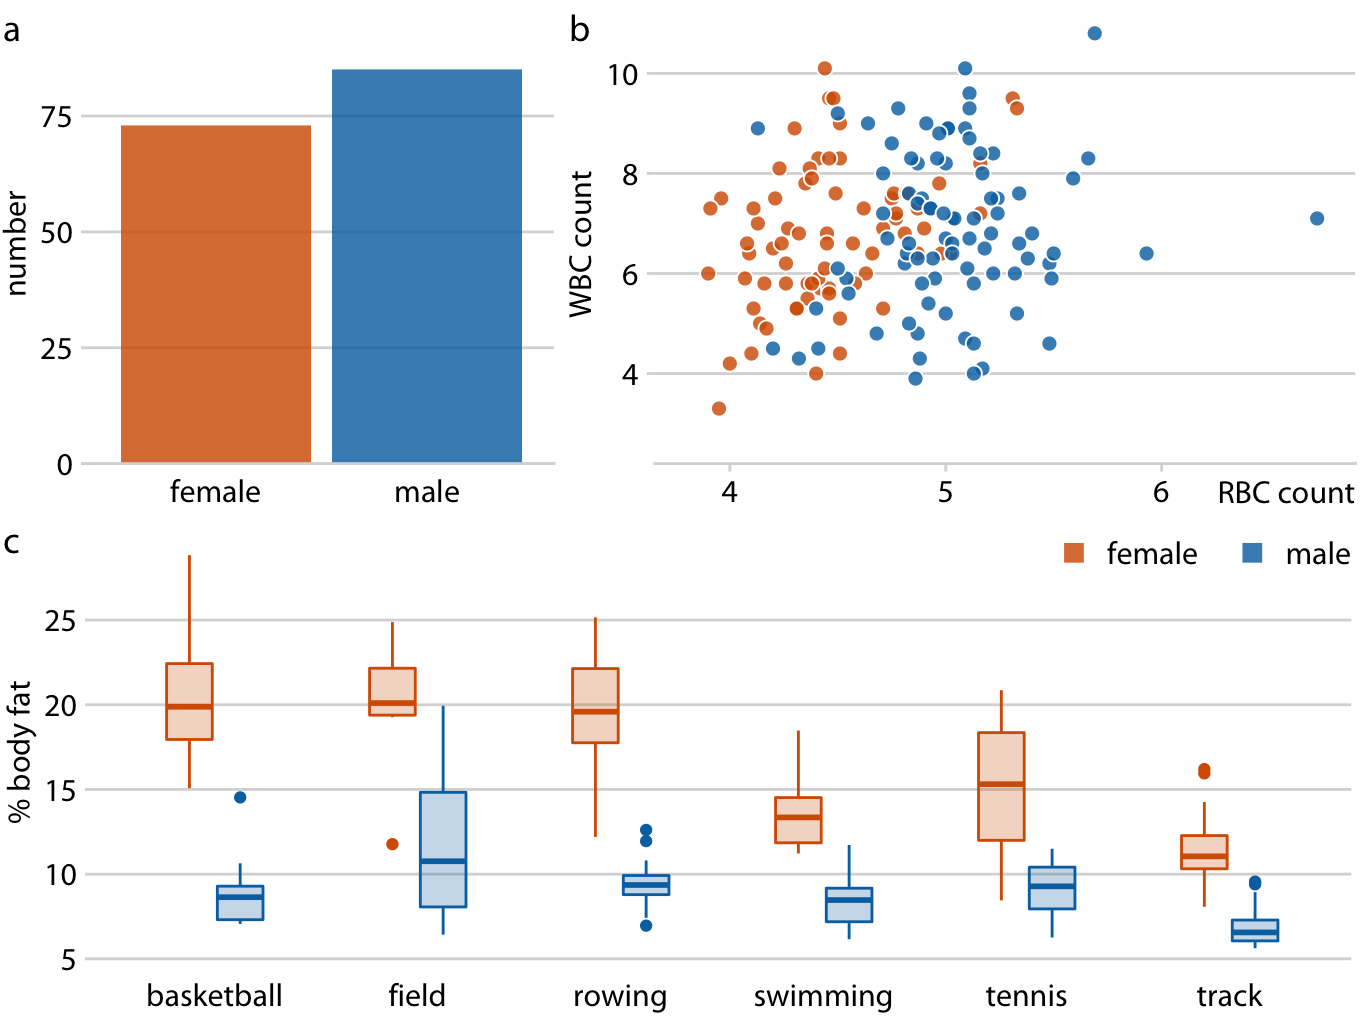
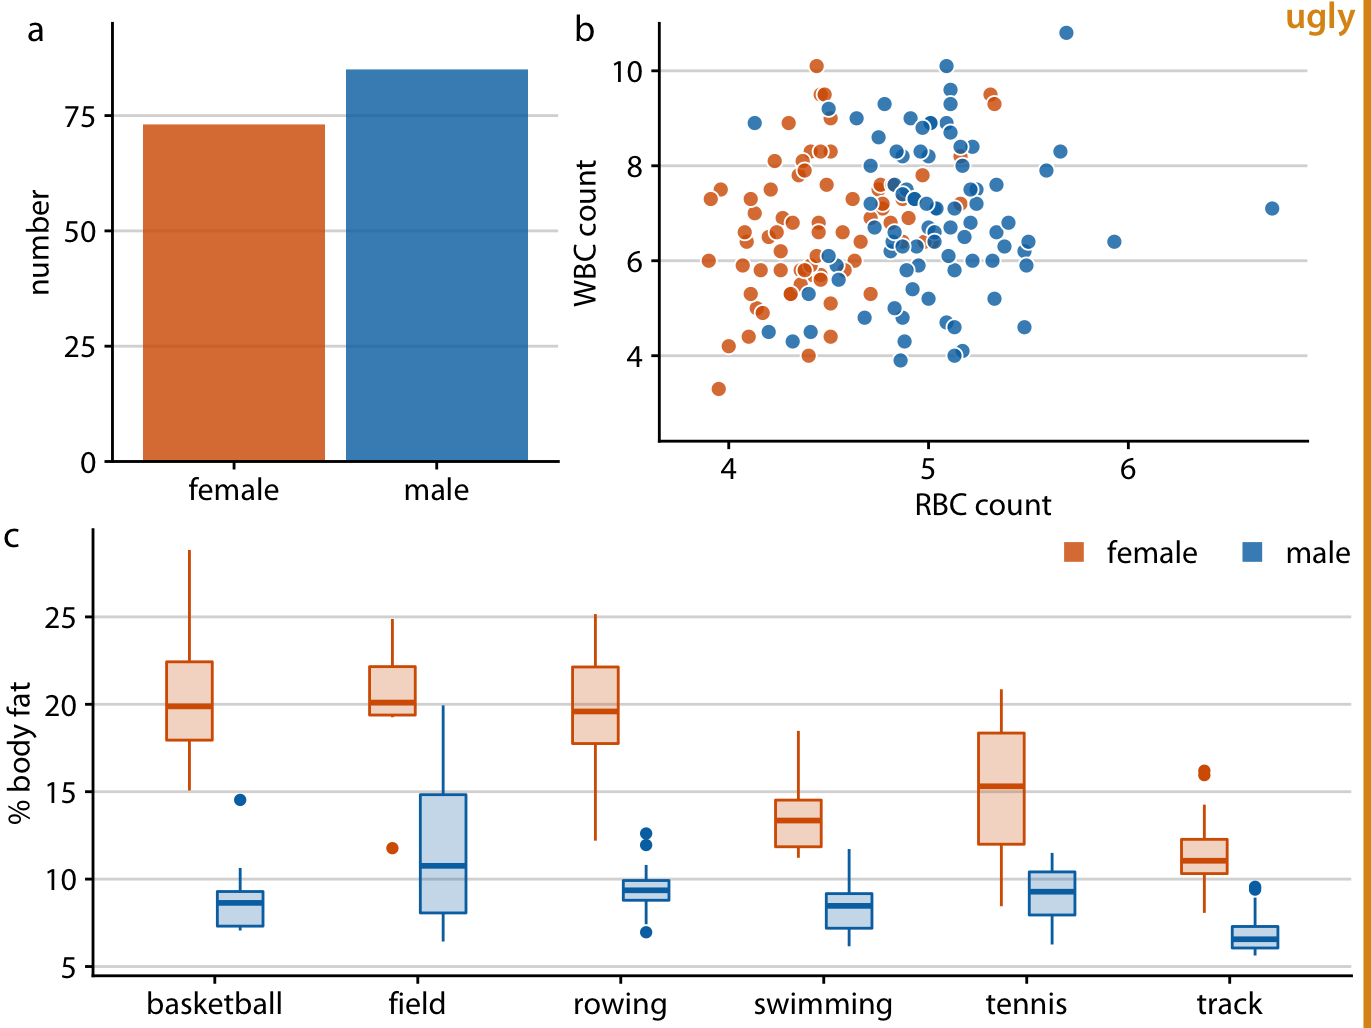
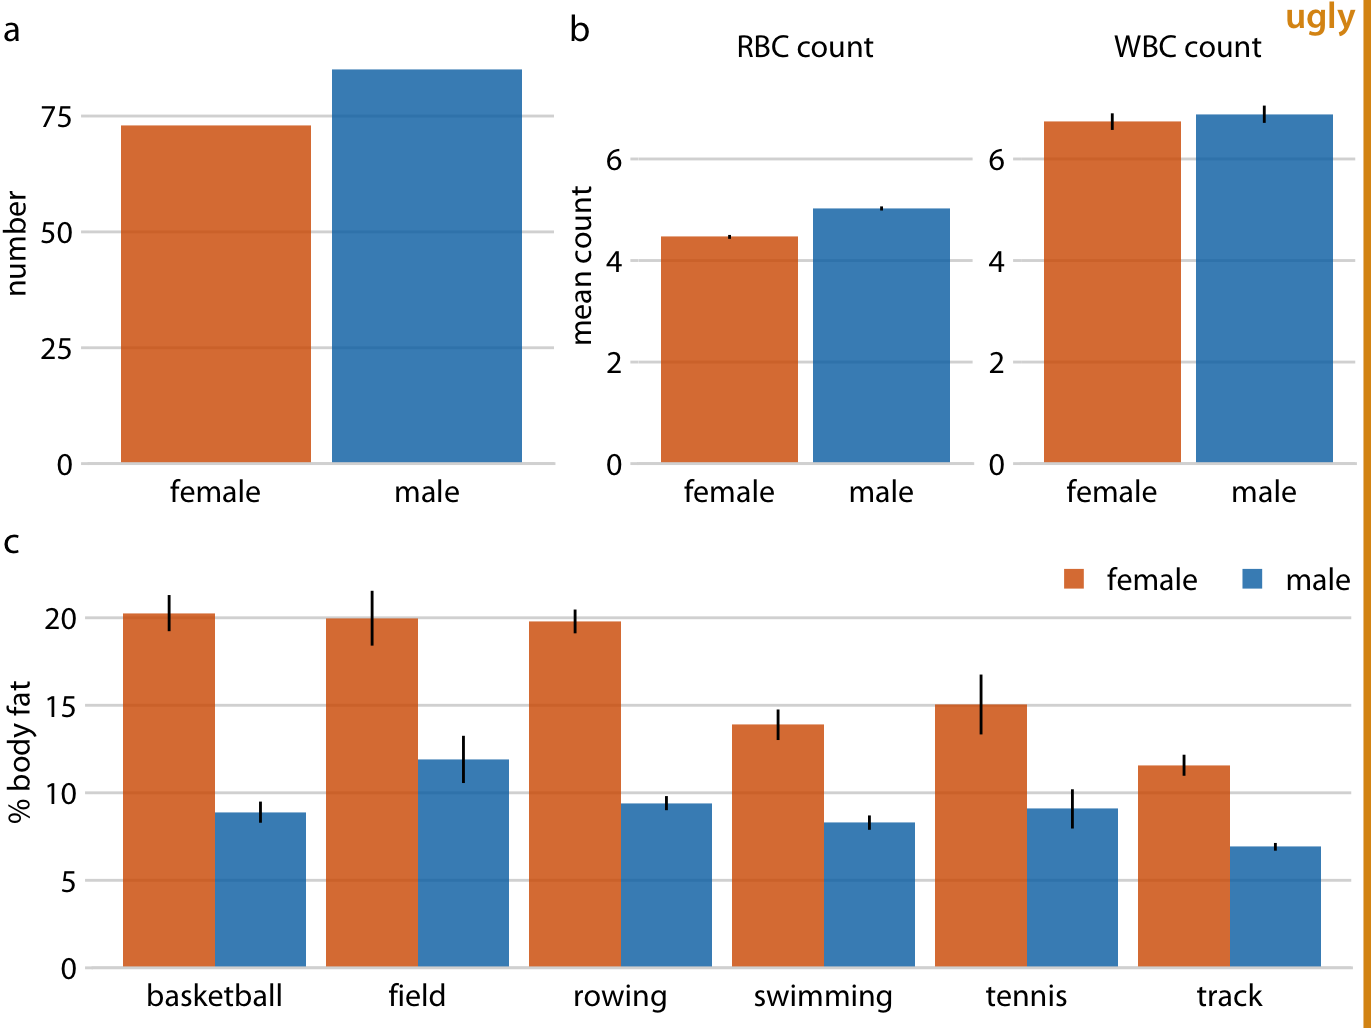
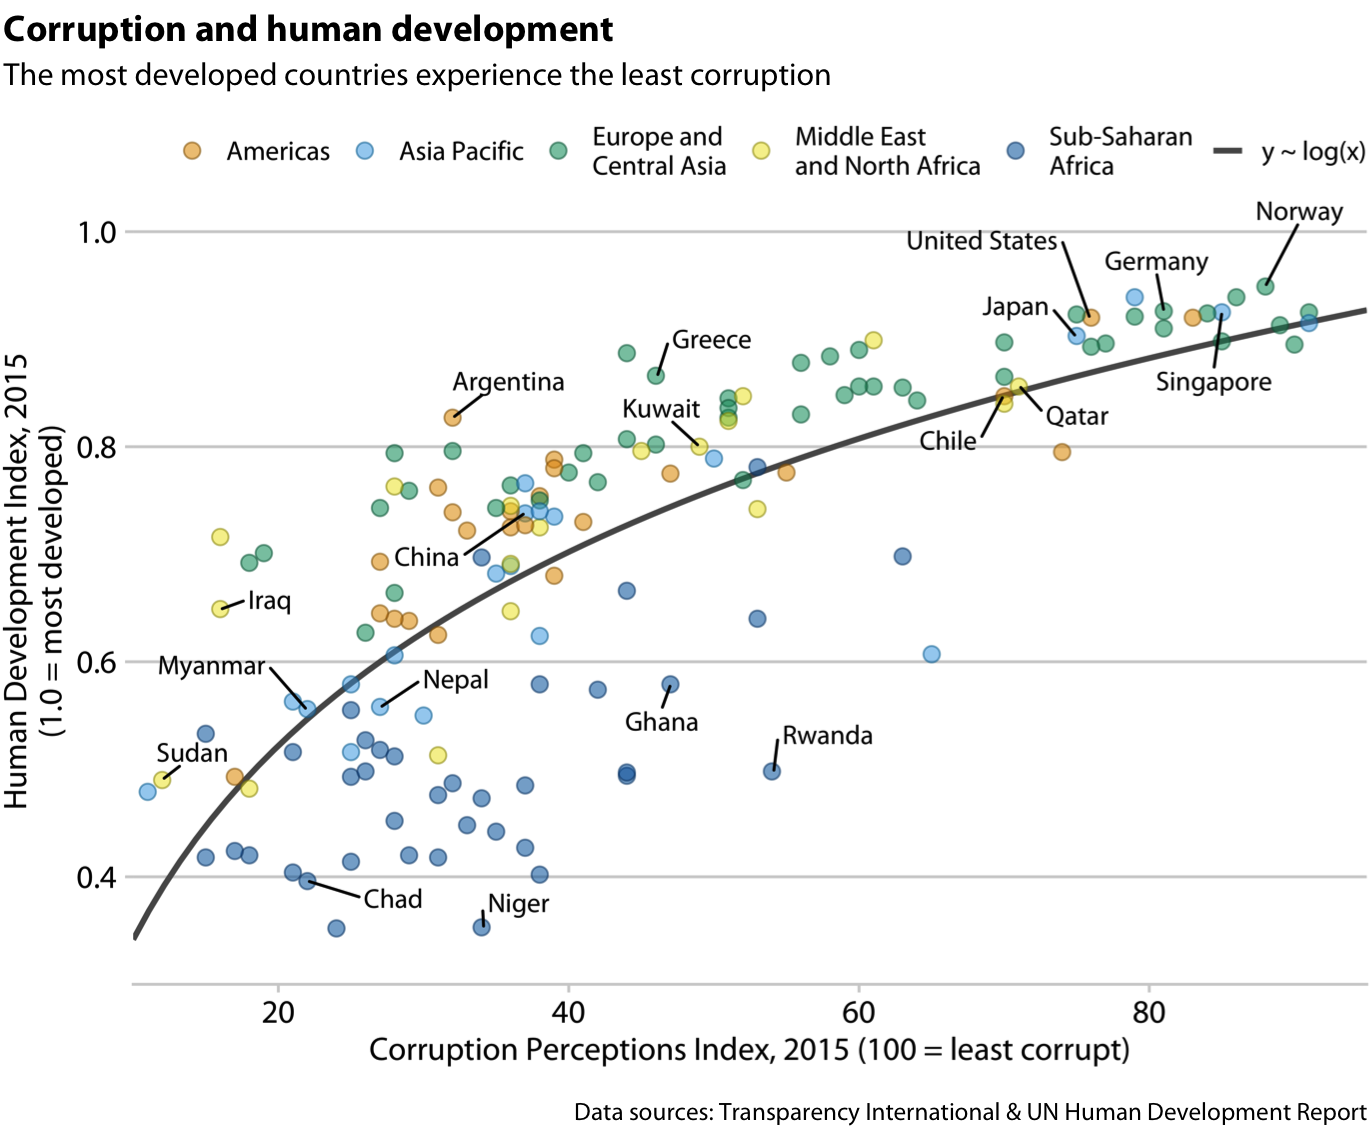
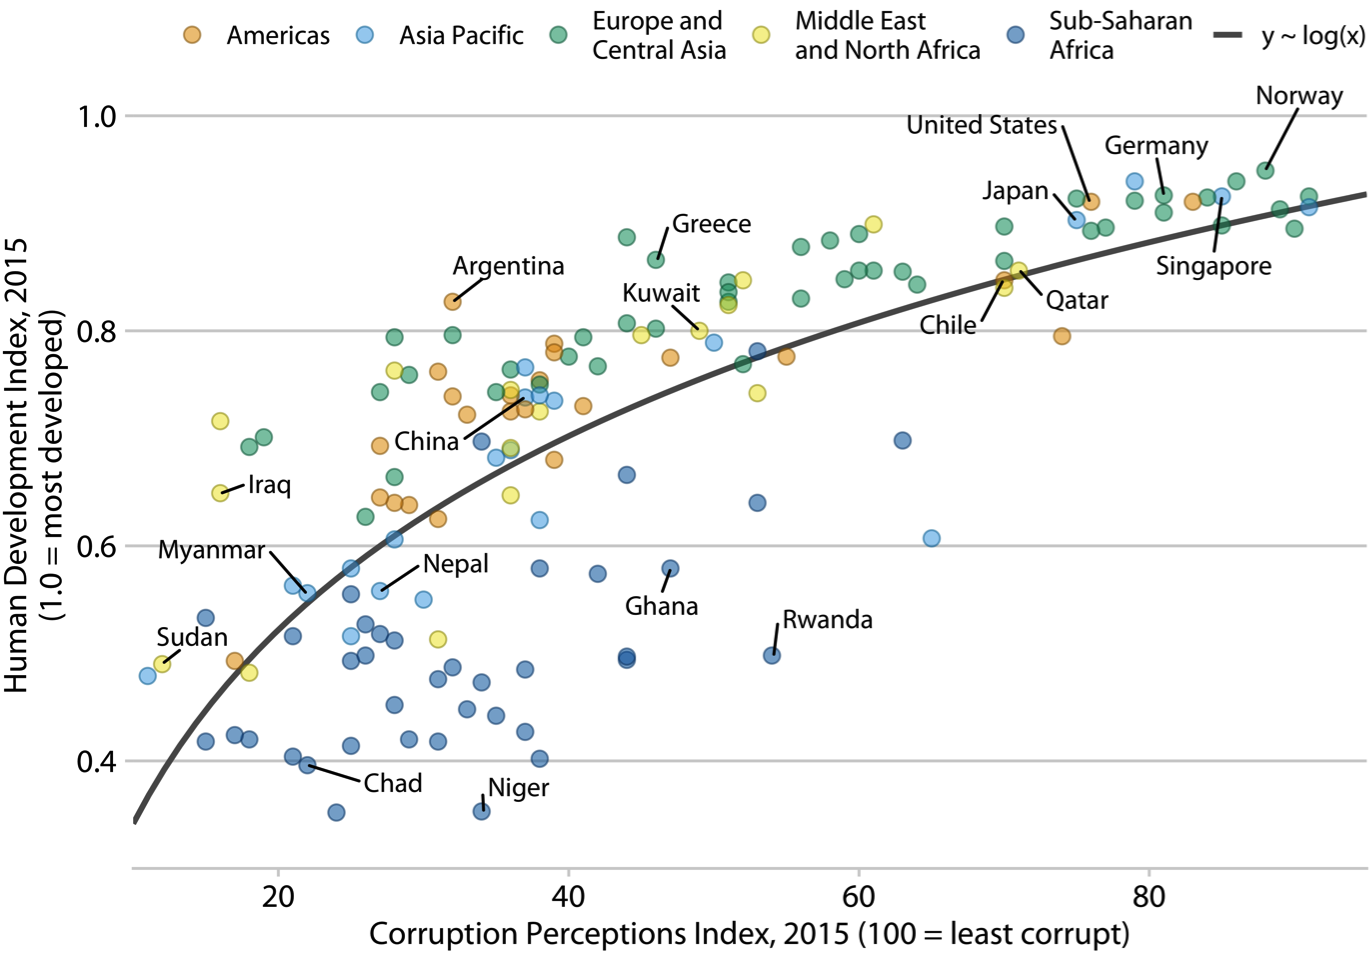
class: center, middle, title-slide # Compound figures ### Claus O. Wilke ### last updated: 2021-09-23 --- ## Compound figures Two common scenarios: -- 1\. The same type of plot is replicated many times (small multiples) -- 2\. Several disparate plots are combined into one display --- background-image: url("https://clauswilke.com/dataviz/multi-panel_figures_files/figure-html/titanic-passenger-breakdown-1.png") background-position: left 50% top 60% background-size: 45% ## 1. Small multiples (facets) ??? Figure from [Claus O. Wilke. Fundamentals of Data Visualization. O'Reilly, 2019.](https://clauswilke.com/dataviz) --- background-image: url("https://clauswilke.com/dataviz/balance_data_context_files/figure-html/titanic-survival-by-gender-class-bad-1.png") background-position: left 50% top 60% background-size: 45% ## 1. Small multiples (facets) .absolute-bottom-left[ Avoid bars or other elements that are floating in space ] ??? Figure from [Claus O. Wilke. Fundamentals of Data Visualization. O'Reilly, 2019.](https://clauswilke.com/dataviz) --- background-image: url("https://clauswilke.com/dataviz/balance_data_context_files/figure-html/titanic-survival-by-gender-class-1.png") background-position: left 50% top 60% background-size: 45% ## 1. Small multiples (facets) ??? Figure from [Claus O. Wilke. Fundamentals of Data Visualization. O'Reilly, 2019.](https://clauswilke.com/dataviz) --- class: center middle ## Small multiples work even for massive amounts of data --- background-image: url("https://clauswilke.com/dataviz/multi-panel_figures_files/figure-html/movie-rankings-1.png") background-position: left 50% top 60% background-size: 45% ??? Figure from [Claus O. Wilke. Fundamentals of Data Visualization. O'Reilly, 2019.](https://clauswilke.com/dataviz) --- background-image: url("https://clauswilke.com/dataviz/multi-panel_figures_files/figure-html/BA-degrees-variable-y-lims-1.png") background-position: left 50% top 70% background-size: 50% ## y-axis ranges should be consistent among panels ??? Figure from [Claus O. Wilke. Fundamentals of Data Visualization. O'Reilly, 2019.](https://clauswilke.com/dataviz) --- background-image: url("https://clauswilke.com/dataviz/multi-panel_figures_files/figure-html/BA-degrees-fixed-y-lims-1.png") background-position: left 50% top 70% background-size: 50% ## y-axis ranges should be consistent among panels ??? Figure from [Claus O. Wilke. Fundamentals of Data Visualization. O'Reilly, 2019.](https://clauswilke.com/dataviz) --- background-image: url("https://clauswilke.com/dataviz/multi-panel_figures_files/figure-html/BA-degrees-compound-1.png") background-position: left 50% top 55% background-size: 75% ## 2. Combining disparate figures into one display ??? Figure from [Claus O. Wilke. Fundamentals of Data Visualization. O'Reilly, 2019.](https://clauswilke.com/dataviz) -- .absolute-bottom-left[ Note: We now need plot labels ("a", "b") to identify sub-plots ] --- background-image: url("https://clauswilke.com/dataviz/multi-panel_figures_files/figure-html/BA-degrees-compound-bad-1.png") background-position: left 50% top 55% background-size: 75% ## Don't use overly large or otherwise prominent labels .absolute-bottom-left[ Note: Also don't use serif fonts (such as Times) for labels ] ??? Figure from [Claus O. Wilke. Fundamentals of Data Visualization. O'Reilly, 2019.](https://clauswilke.com/dataviz) --- background-image: url("https://clauswilke.com/dataviz/multi-panel_figures_files/figure-html/athletes-composite-good-1.png") background-position: left 50% top 65% background-size: 50% ## Use a consistent color language among sub-plots ??? Figure from [Claus O. Wilke. Fundamentals of Data Visualization. O'Reilly, 2019.](https://clauswilke.com/dataviz) --- background-image: url("https://clauswilke.com/dataviz/multi-panel_figures_files/figure-html/athletes-composite-inconsistent-1.png") background-position: left 50% top 65% background-size: 50% ## Use a consistent color language among sub-plots ??? Figure from [Claus O. Wilke. Fundamentals of Data Visualization. O'Reilly, 2019.](https://clauswilke.com/dataviz) --- background-image: url("https://clauswilke.com/dataviz/multi-panel_figures_files/figure-html/athletes-composite-good-1.png") background-position: left 50% top 65% background-size: 50% ## Pay attention to sub-plot alignment ??? Figure from [Claus O. Wilke. Fundamentals of Data Visualization. O'Reilly, 2019.](https://clauswilke.com/dataviz) --- background-image: url("https://clauswilke.com/dataviz/multi-panel_figures_files/figure-html/athletes-composite-misaligned-1.png") background-position: left 50% top 65% background-size: 50% ## Pay attention to sub-plot alignment ??? Figure from [Claus O. Wilke. Fundamentals of Data Visualization. O'Reilly, 2019.](https://clauswilke.com/dataviz) --- background-image: url("https://clauswilke.com/dataviz/multi-panel_figures_files/figure-html/athletes-composite-good-1.png") background-position: left 50% top 65% background-size: 50% ## Combine plots of different types .absolute-bottom-left[ This helps your readers to distinguish different parts of the analysis ] ??? Figure from [Claus O. Wilke. Fundamentals of Data Visualization. O'Reilly, 2019.](https://clauswilke.com/dataviz) --- background-image: url("https://clauswilke.com/dataviz/telling_a_story_files/figure-html/athletes-composite-repetitive-1.png") background-position: left 50% top 65% background-size: 50% ## Combine plots of different types .absolute-bottom-left[ This helps your readers to distinguish different parts of the analysis ] ??? Figure from [Claus O. Wilke. Fundamentals of Data Visualization. O'Reilly, 2019.](https://clauswilke.com/dataviz) --- background-image: url("https://clauswilke.com/dataviz/multi-panel_figures_files/figure-html/athletes-composite-good-1.png") background-position: left 50% top 65% background-size: 50% ## Combine plots of different types .absolute-bottom-left[ This helps your readers to distinguish different parts of the analysis ] ??? Figure from [Claus O. Wilke. Fundamentals of Data Visualization. O'Reilly, 2019.](https://clauswilke.com/dataviz) --- ## Distinguish infographics from figures in article/book There are two distinct use cases: -- **Infographic:** Standalone, has title/subtitle/caption -- **Figure in article/book:** Caption contains title, not part of figure --- background-image: url("https://clauswilke.com/dataviz/figure_titles_captions_files/figure-html/corruption-development-infographic-1.png") background-position: left 50% top 45% background-size: 50% .absolute-bottom-left[ Example of infographic ] ??? Figure from [Claus O. Wilke. Fundamentals of Data Visualization. O'Reilly, 2019.](https://clauswilke.com/dataviz) --- background-image: url("https://clauswilke.com/dataviz/figure_titles_captions_files/figure-html/corruption-development-1.png") background-position: left 15% top 40% background-size: 50% .pull-right.width-35.move-down-2em.small-font[ Figure 1. **Corruption and human development.** The most developed countries experience the least corruption. Inspired by a posting in [The Economist online (2011)](https://www.economist.com/graphic-detail/2011/12/02/corrosive-corruption). Data sources: Transparency International & UN Human Development Report. ] .absolute-bottom-left[ Example of figure in article or book ] ??? Figure from [Claus O. Wilke. Fundamentals of Data Visualization. O'Reilly, 2019.](https://clauswilke.com/dataviz) [//]: # "segment ends here" --- class: center middle ## Making compound plots in R --- ## The **patchwork** package .tiny-font.pull-left.width-40[ ```r library(patchwork) # make first plot p1 <- ggplot(mtcars) + geom_point(aes(mpg, disp)) p1 ``` ] .pull-right.width-55[ ![](compound-figures_files/figure-html/patchwork-demo1-out-1.svg)<!-- --> ] --- ## The **patchwork** package .tiny-font.pull-left.width-40[ ```r library(patchwork) # make first plot p1 <- ggplot(mtcars) + geom_point(aes(mpg, disp)) # make second plot p2 <- ggplot(mtcars) + aes(gear, disp, group = gear) + geom_boxplot() p2 ``` ] .pull-right.width-55[ ![](compound-figures_files/figure-html/patchwork-demo2-out-1.svg)<!-- --> ] --- ## The **patchwork** package .tiny-font.pull-left.width-40[ ```r library(patchwork) # make first plot p1 <- ggplot(mtcars) + geom_point(aes(mpg, disp)) # make second plot p2 <- ggplot(mtcars) + aes(gear, disp, group = gear) + geom_boxplot() *# place plots side-by-side *p1 | p2 ``` ] .pull-right.width-55[ ![](compound-figures_files/figure-html/patchwork-demo3-out-1.svg)<!-- --> ] --- ## The **patchwork** package .tiny-font.pull-left.width-40[ ```r library(patchwork) # make first plot p1 <- ggplot(mtcars) + geom_point(aes(mpg, disp)) # make second plot p2 <- ggplot(mtcars) + aes(gear, disp, group = gear) + geom_boxplot() *# place plots on top of one-another *p1 / p2 ``` ] .pull-right.width-40.move-up-3em[ ![](compound-figures_files/figure-html/patchwork-demo4-out-1.svg)<!-- --> ] --- ## The **patchwork** package .tiny-font.pull-left.width-35[ ```r # add a few more plots p3 <- ggplot(mtcars) + geom_smooth(aes(disp, qsec)) p4 <- ggplot(mtcars) + geom_bar(aes(carb)) *# make complex arrangement *(p1 | p2 | p3) / p4 ``` ] .pull-right.width-60.move-up-1em[ ![](compound-figures_files/figure-html/patchwork-demo5-out-1.svg)<!-- --> ] --- ## Plot annotations and themes .tiny-font.pull-left.width-35[ ```r (p1 | p2 | p3) / p4 + * plot_annotation( * tag_levels = "A" * ) ``` Automatic labeling of plots ] .pull-right.width-60.move-up-1em[ ![](compound-figures_files/figure-html/patchwork-demo6-out-1.svg)<!-- --> ] --- ## Plot annotations and themes .tiny-font.pull-left.width-35[ ```r (p1 | p2 | p3) / p4 + * plot_annotation( * tag_levels = "a" * ) ``` Automatic labeling of plots ] .pull-right.width-60.move-up-1em[ ![](compound-figures_files/figure-html/patchwork-demo7-out-1.svg)<!-- --> ] --- ## Plot annotations and themes .tiny-font.pull-left.width-35[ ```r (p1 | p2 | p3) / p4 + plot_annotation( tag_levels = "a" * ) & * theme_minimal_grid() ``` Applying one theme to all plots ] .pull-right.width-60.move-up-1em[ ![](compound-figures_files/figure-html/patchwork-demo8-out-1.svg)<!-- --> ] --- ## Plot annotations and themes .tiny-font.pull-left.width-35[ ```r (p1 | p2 | p3) / p4 + plot_annotation( tag_levels = "a", * title = "A plot about mtcars", * subtitle = "With subtitle...", * caption = "...and caption" ) & theme_minimal_grid() ``` Titles and captions ] .pull-right.width-60.move-up-1em[ ![](compound-figures_files/figure-html/patchwork-demo9-out-1.svg)<!-- --> ] [//]: # "segment ends here" --- ## Further reading - Fundamentals of Data Visualization: [Chapter 21: Multi-panel figures](https://clauswilke.com/dataviz/multi-panel-figures.html) - **patchwork** documentation: [Getting started](https://patchwork.data-imaginist.com/articles/patchwork.html) - **patchwork** documentation: [Plot assembly](https://patchwork.data-imaginist.com/articles/guides/assembly.html) - **patchwork** documentation: [Adding annotation and style](https://patchwork.data-imaginist.com/articles/guides/annotation.html)