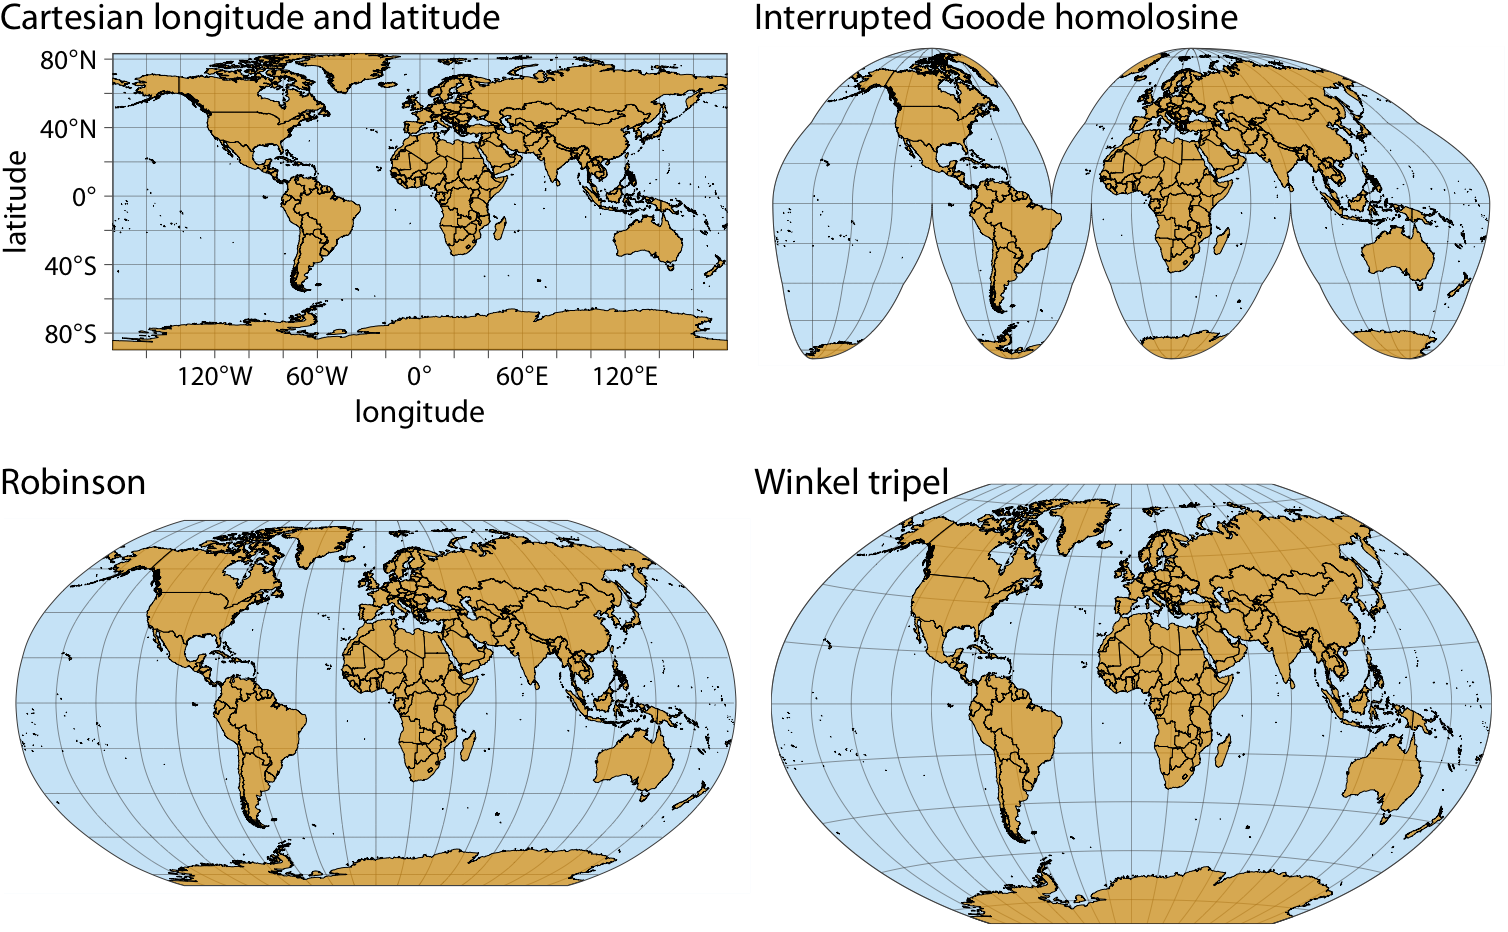
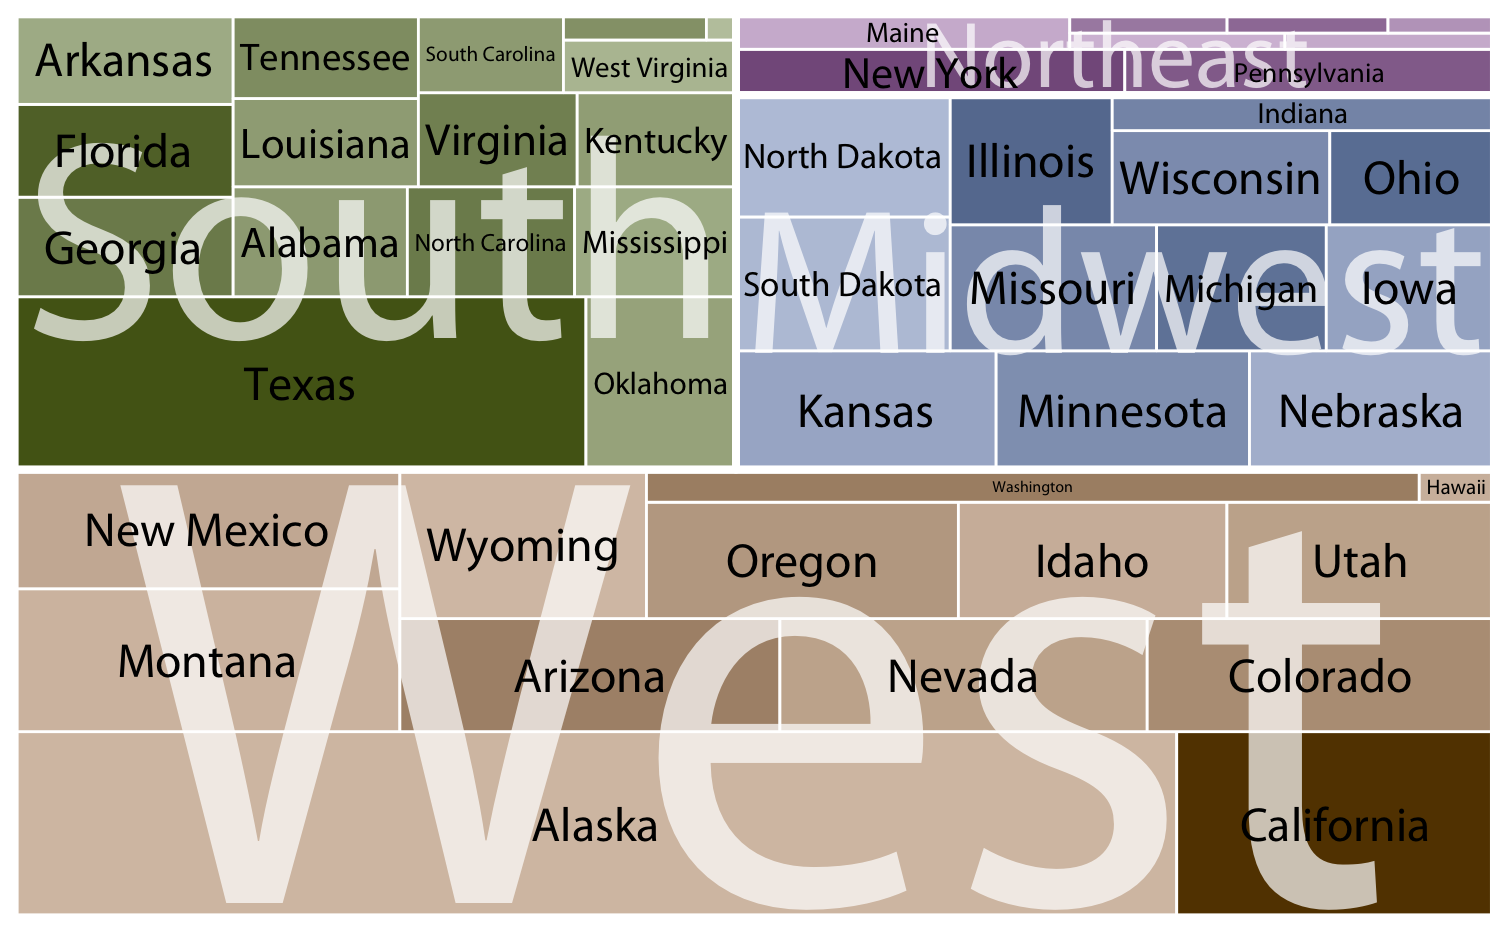
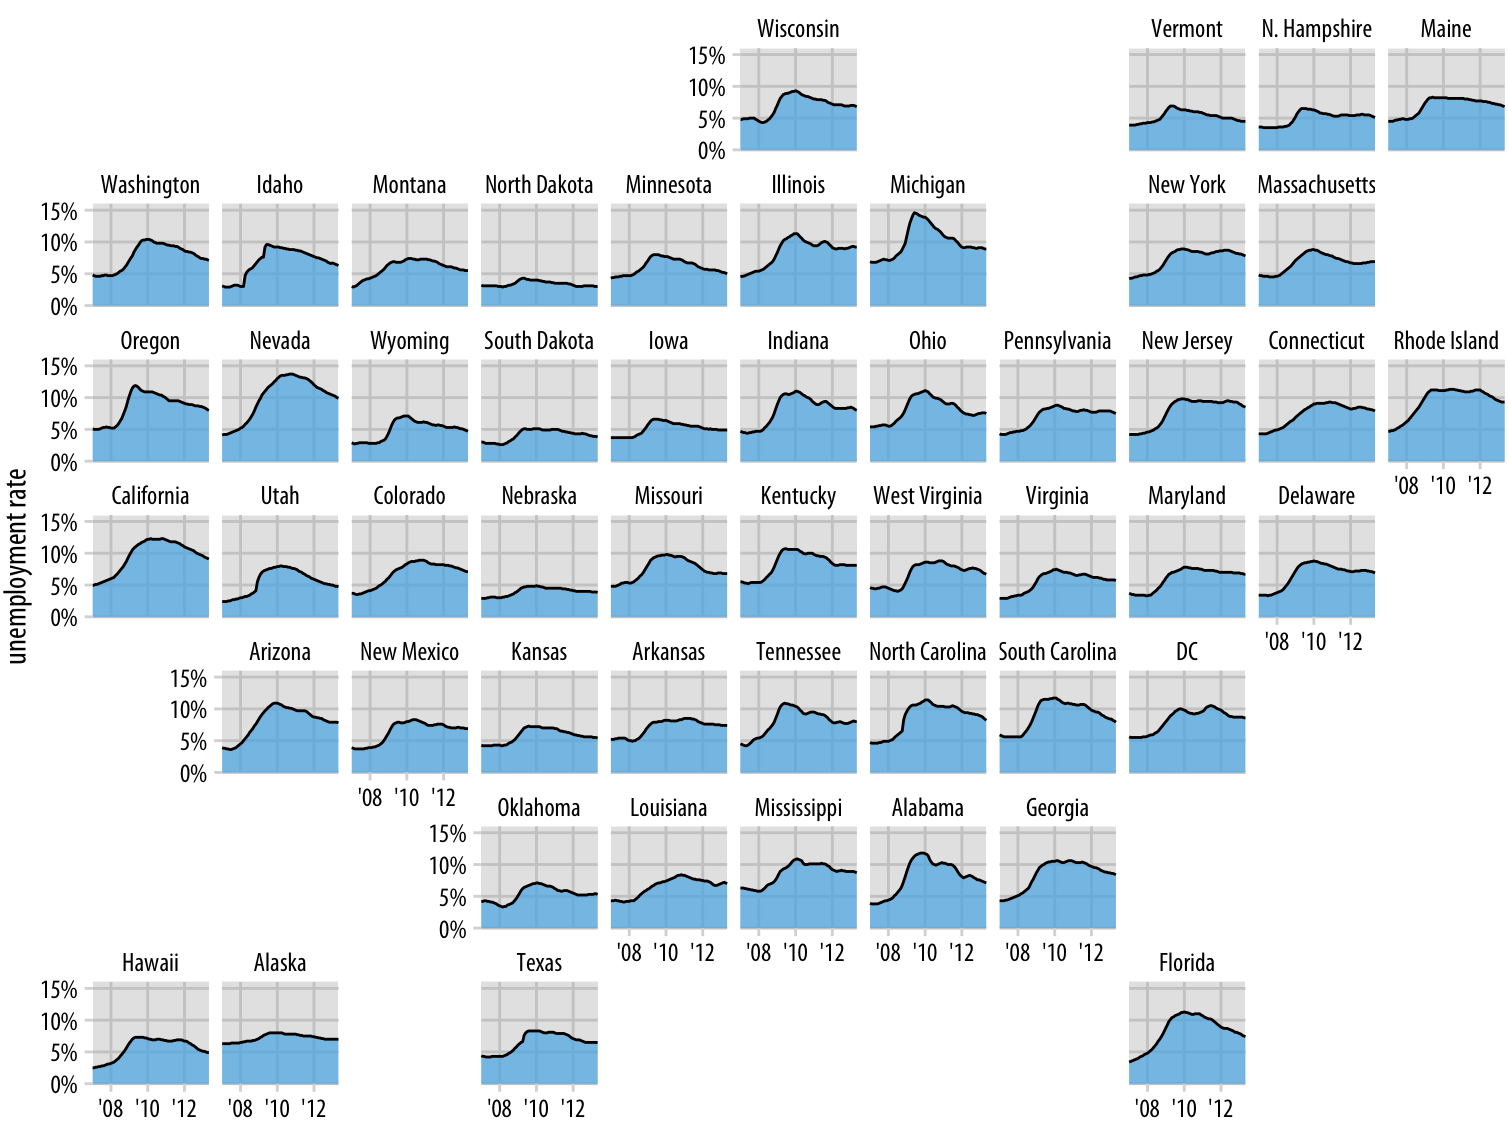
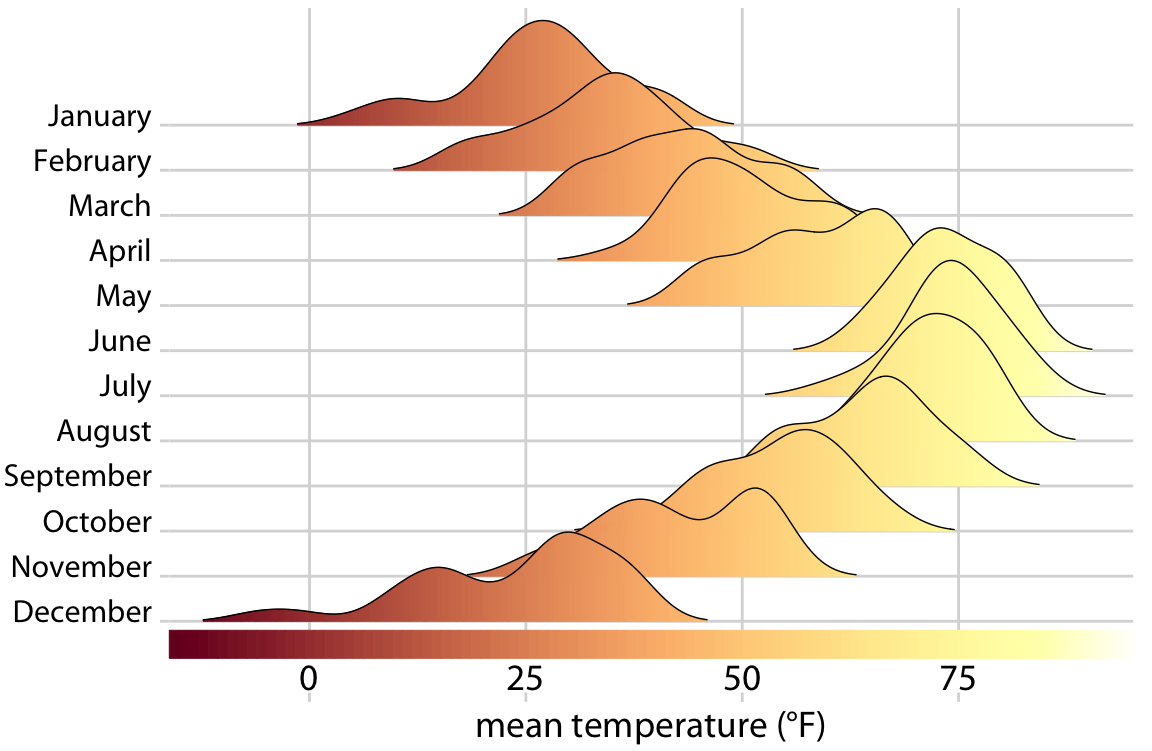
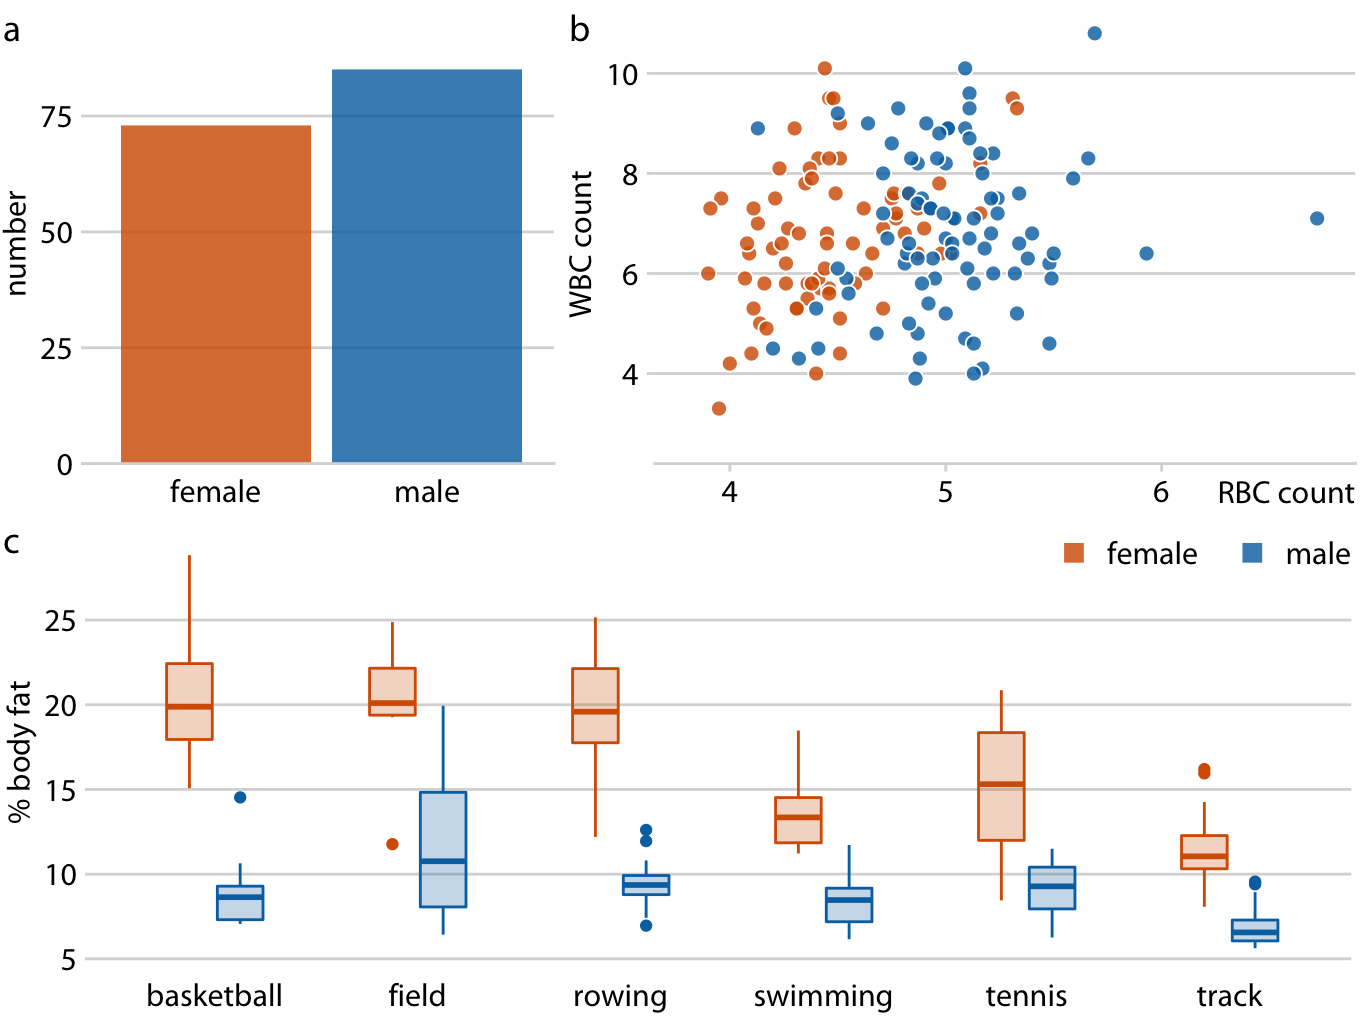
class: center, middle, title-slide # Introduction ### Claus O. Wilke ### last updated: 2022-01-17 --- ## Why Data Visualization? -- <br> .center[ <img src = "introduction_files/Data_science_venn.svg", width = 60%></img> ] --- ## Why Data Visualization? <br> .center[ <img src = "introduction_files/Data_visualization_venn.svg", width = 60%></img> ] --- ## Why R? -- <img src = "introduction_files/Rlogo.svg", width = 25%, style = "position:absolute; top: 18%; left: 15%;"></img> <img src = "introduction_files/Data_science_venn.svg", width = 40%, style = "position:absolute; top: 57%; left: 8%;"></img> ??? The R logo [is distributed](https://www.r-project.org/logo/) under the terms of the Creative Commons Attribution-ShareAlike 4.0 International license ([CC-BY-SA 4.0](https://creativecommons.org/licenses/by-sa/4.0/)). RStudio hex stickers [are distributed](https://github.com/rstudio/hex-stickers) under [CC0.](https://github.com/rstudio/hex-stickers/blob/master/LICENSE.md) -- <img src = "introduction_files/package-hexlogos.svg", width = 35%, style = "position:absolute; top: 5%; left: 55%;"></img> --- ## Why me? -- <img src = "https://clauswilke.com/dataviz/cover.png", width = 30%, style = "position:absolute; top: 18%; left: 13%; box-shadow: 3px 5px 3px 1px #00000080;"></img> <br><br><br><br><br><br><br><br><br><br><br><br><br><br> .pull-left.small-font[ .center[ https://clauswilke.com/dataviz ] ] -- <img src = "https://clauswilke.com/dataviz/coordinate_systems_axes_files/figure-html/worldmap-four-projections-1.png", width = 30%, style = "position:absolute; top: 12%; left: 45%; box-shadow: 3px 5px 3px 1px #00000080;"></img> -- <img src = "https://clauswilke.com/dataviz/nested_proportions_files/figure-html/US-states-treemap-1.png", width = 30%, style = "position:absolute; top: 22%; left: 55%; box-shadow: 3px 5px 3px 1px #00000080;"></img> -- <img src = "https://clauswilke.com/dataviz/geospatial_data_files/figure-html/unemployment-geofacet-1.png", width = 30%, style = "position:absolute; top: 32%; left: 65%; box-shadow: 3px 5px 3px 1px #00000080;"></img> -- <img src = "https://clauswilke.com/dataviz/redundant_coding_files/figure-html/temp-ridgeline-colorbar-1.png", width = 30%, style = "position:absolute; top: 42%; left: 50%; box-shadow: 3px 5px 3px 1px #00000080;"></img> -- <img src = "https://clauswilke.com/dataviz/multi-panel_figures_files/figure-html/athletes-composite-good-1.png", width = 30%, style = "position:absolute; top: 52%; left: 60%; box-shadow: 3px 5px 3px 1px #00000080;"></img> --- ## Why me? .center[ <img src = "introduction_files/ggplot2-website-title.png", width = 60%></img> ] -- .center[ <img src = "introduction_files/ggplot2-website-footer.png", width = 60%></img> ] [//]: # "segment ends here" --- class: center middle ## The first core concept: Markdown --- ## The first core concept: Markdown **Input:** .small-font[ ``` This is a sentence in Markdown, containing `code`, **bold text**, and *italics*. ``` ] -- **Output:** .small-font[ This is a sentence in Markdown, containing `code`, **bold text**, and *italics*. ] --- ## The first core concept: Markdown .pull-left[ **Input:** .small-font[ ``` ## 1 Introduction Data visualization is part art and part science. The challenge is to get the art right without getting the science wrong and vice versa. ``` ]] .pull-right[ **Output:** ## 1 Introduction Data visualization is part art and part science. The challenge is to get the art right without getting the science wrong and vice versa. ] .absolute-bottom-right[ Text taken from: C. O. Wilke, [Fundamentals of Data Visualization](https://clauswilke.com/dataviz/introduction.html) ] --- ## R Markdown combines Markdown and R code -- **Input:** .small-font[ ```` The function `rnorm()` creates normal variates. ```{R} rnorm(5) # create 5 normal variates ``` ```` ] -- **Output:** .small-font[ The function `rnorm()` creates normal variates. ```r rnorm(5) # create 5 normal variates ``` ``` [1] -0.7007392 -0.5225379 0.2926112 -0.4582357 0.7565365 ``` ] [//]: # "segment ends here" --- class: center middle ## Using R Markdown in RStudio --- ## Knitting an R Markdown file .center[ <img src = "introduction_files/RStudio-markdown.png", width = 80%, style = "position:relative; top:-52px;"></img> ] --- ## Knitting an R Markdown file .center[ <img src = "introduction_files/RStudio-markdown-edited.png", width = 80%, style = "position:relative; top:-52px;"></img> ] --- ## Knitting an R Markdown file .center[ <img src = "introduction_files/markdown-knitted.png", width = 80%, style = "position:relative; top:-52px;"></img> ] [//]: # "segment ends here" --- ## Further reading - [R Markdown tutorial](https://rmarkdown.rstudio.com/lesson-2.html) - [R Markdown cheatsheet](https://github.com/rstudio/cheatsheets/raw/main/rmarkdown.pdf) - [R Markdown book](https://bookdown.org/yihui/rmarkdown/)