Compound Figures
2025-03-04
Small multiples (facets)
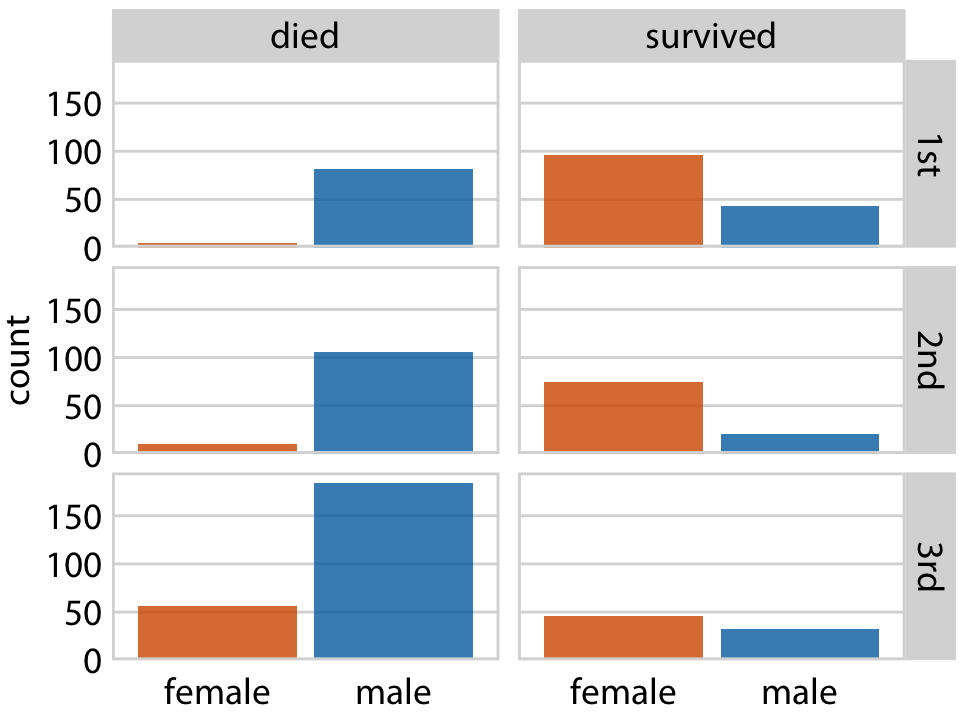
Small multiples (facets)
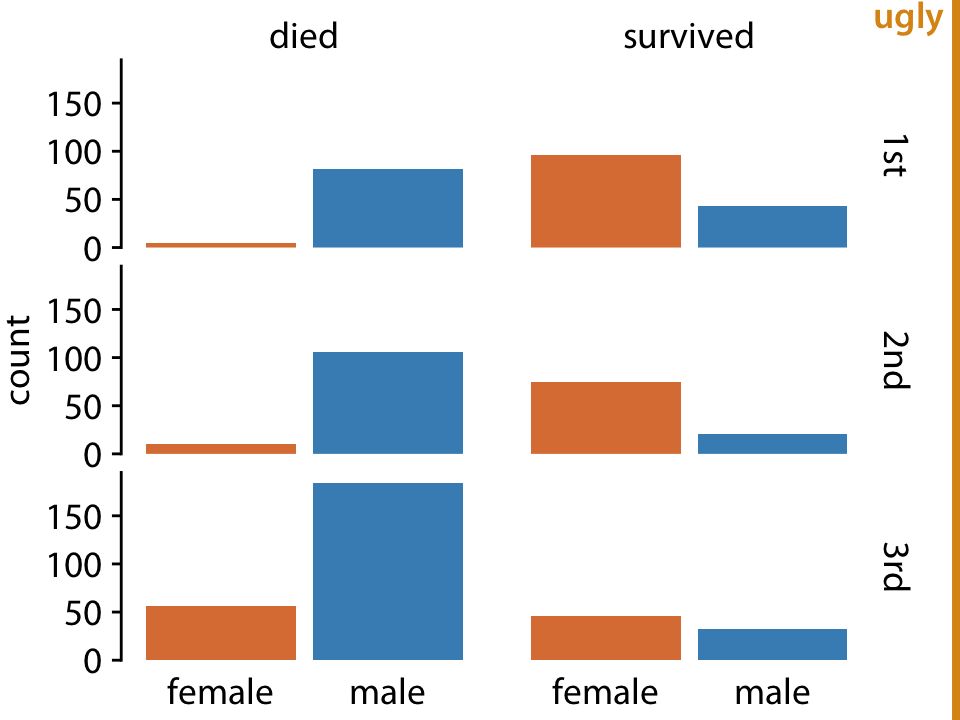
Avoid bars or other elements that are floating in space
Small multiples (facets)
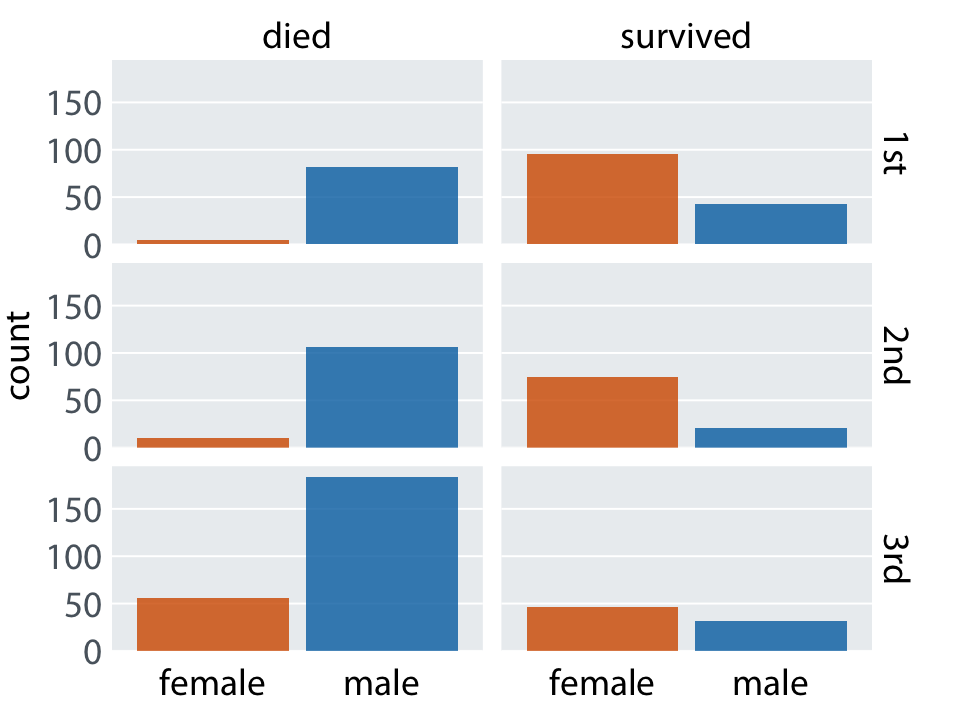
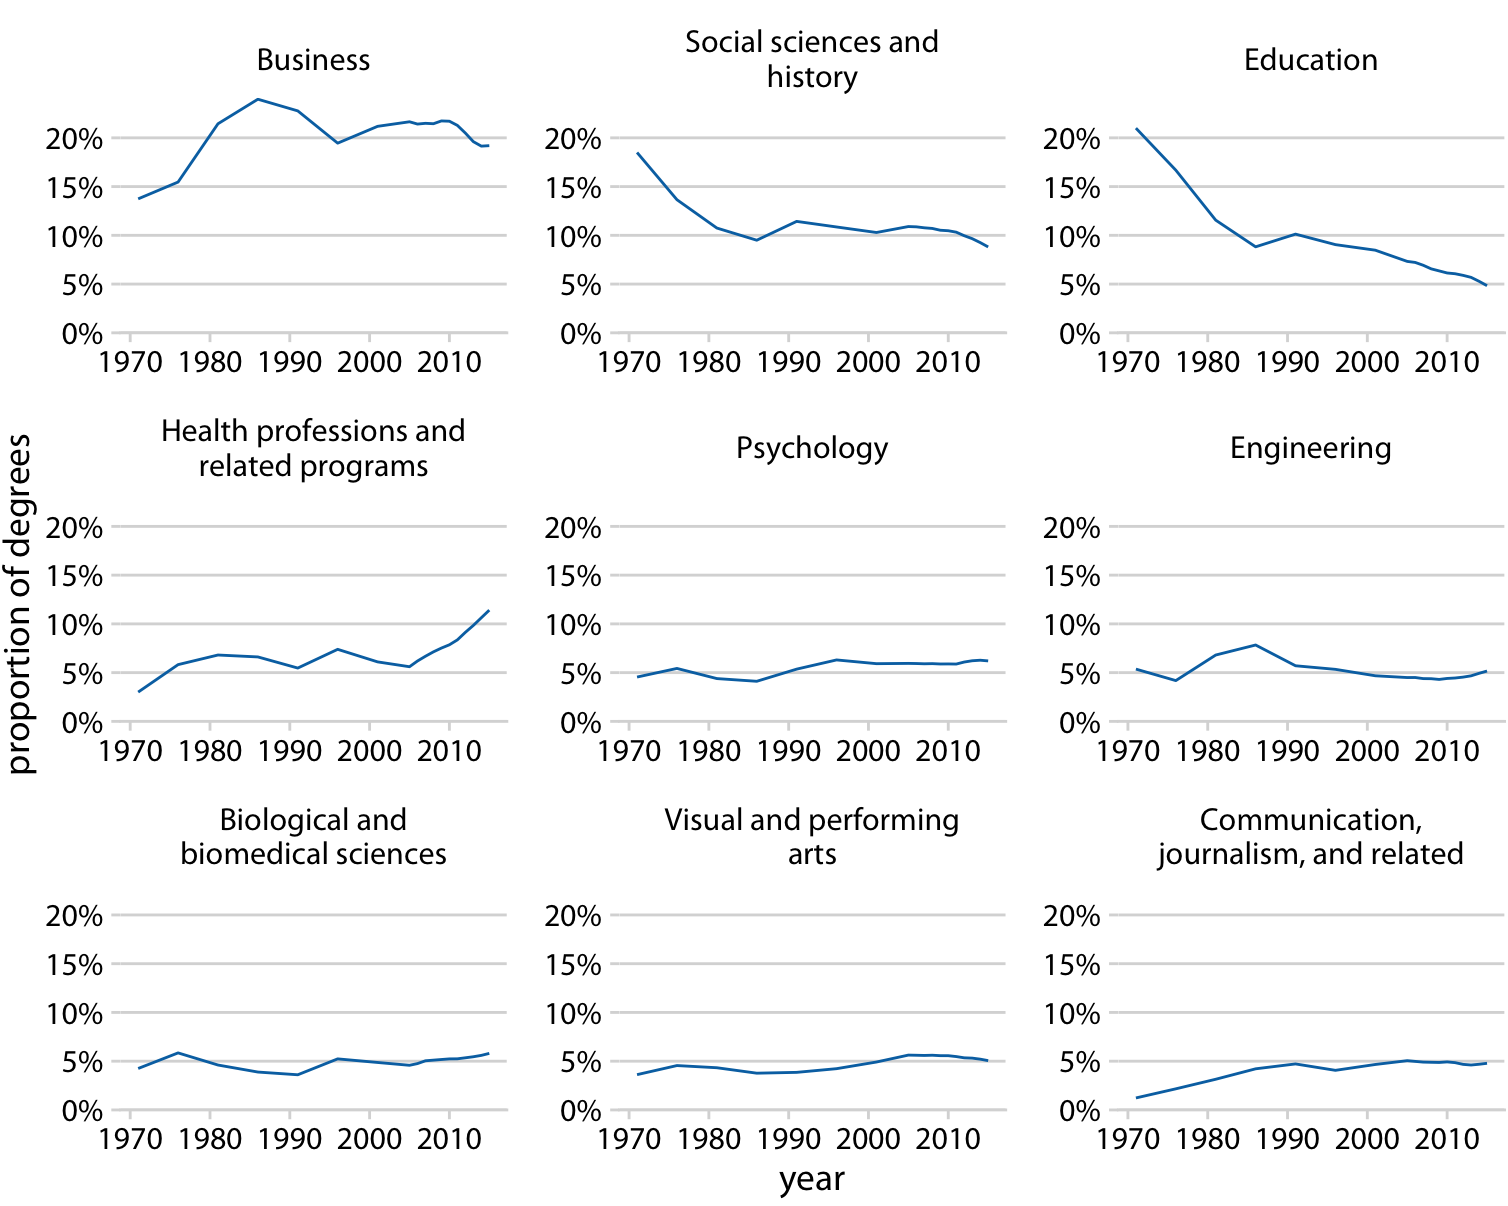
y-axis ranges should be consistent among panels
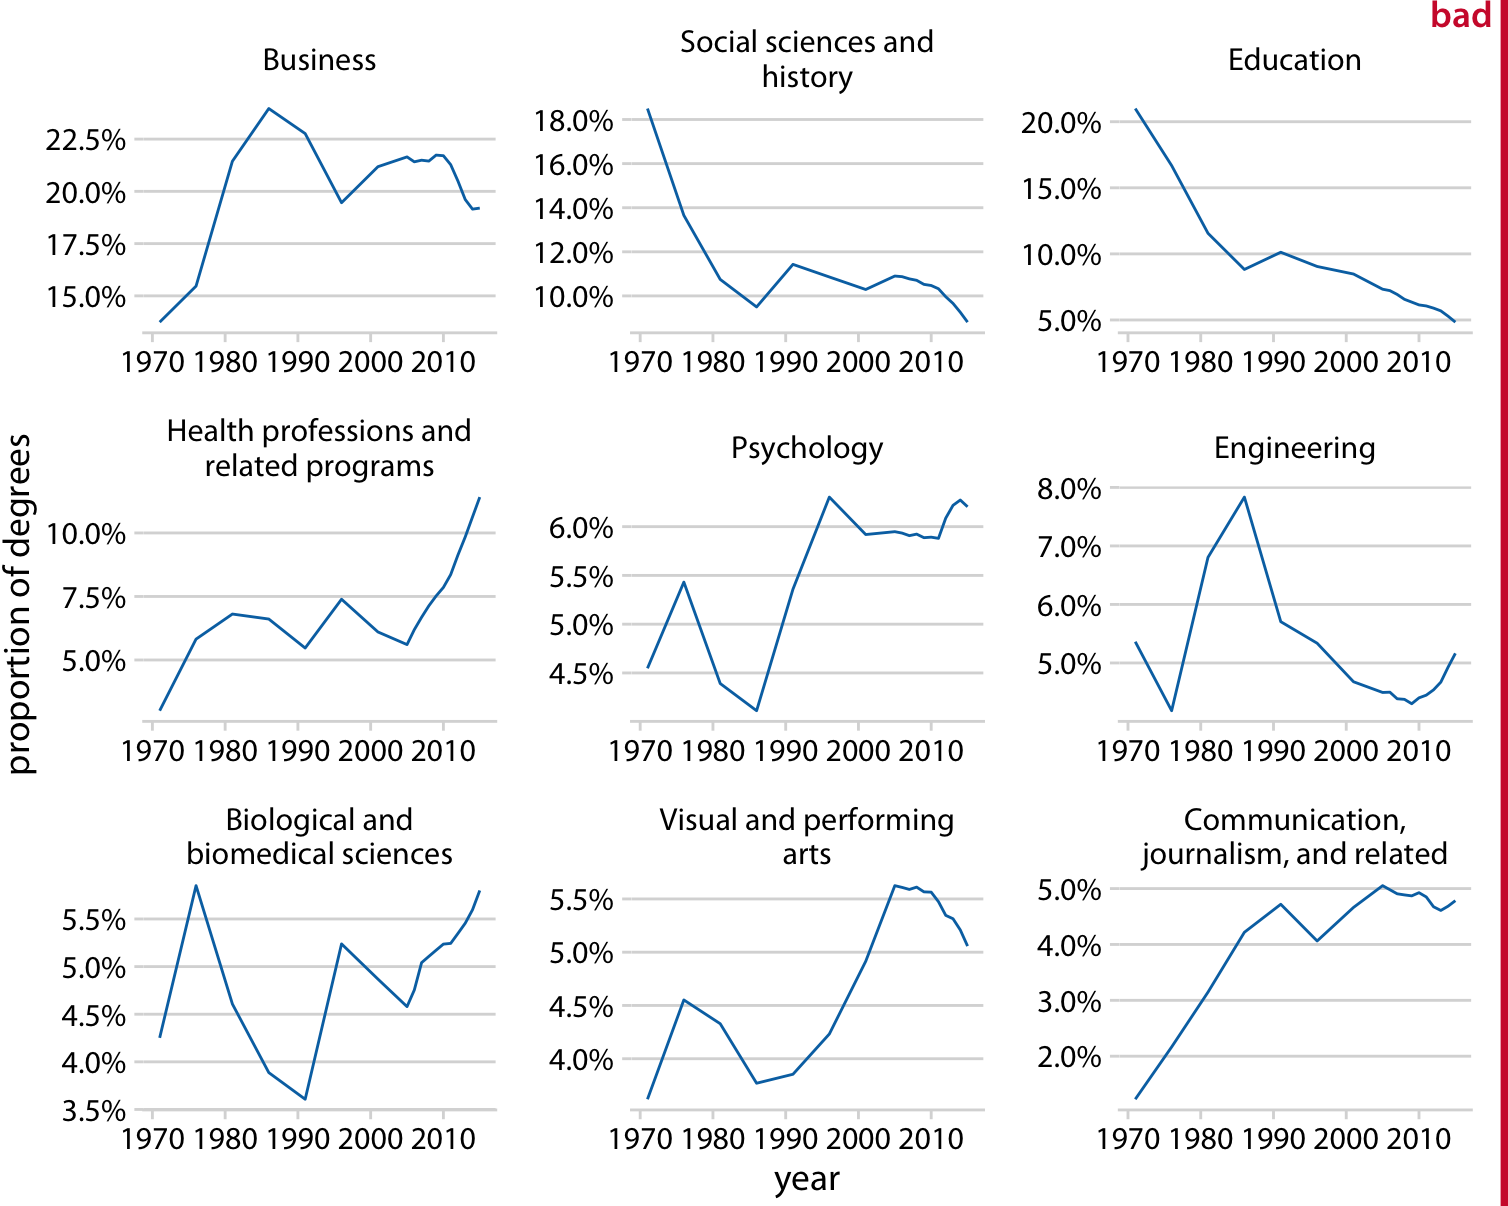
y-axis ranges should be consistent among panels
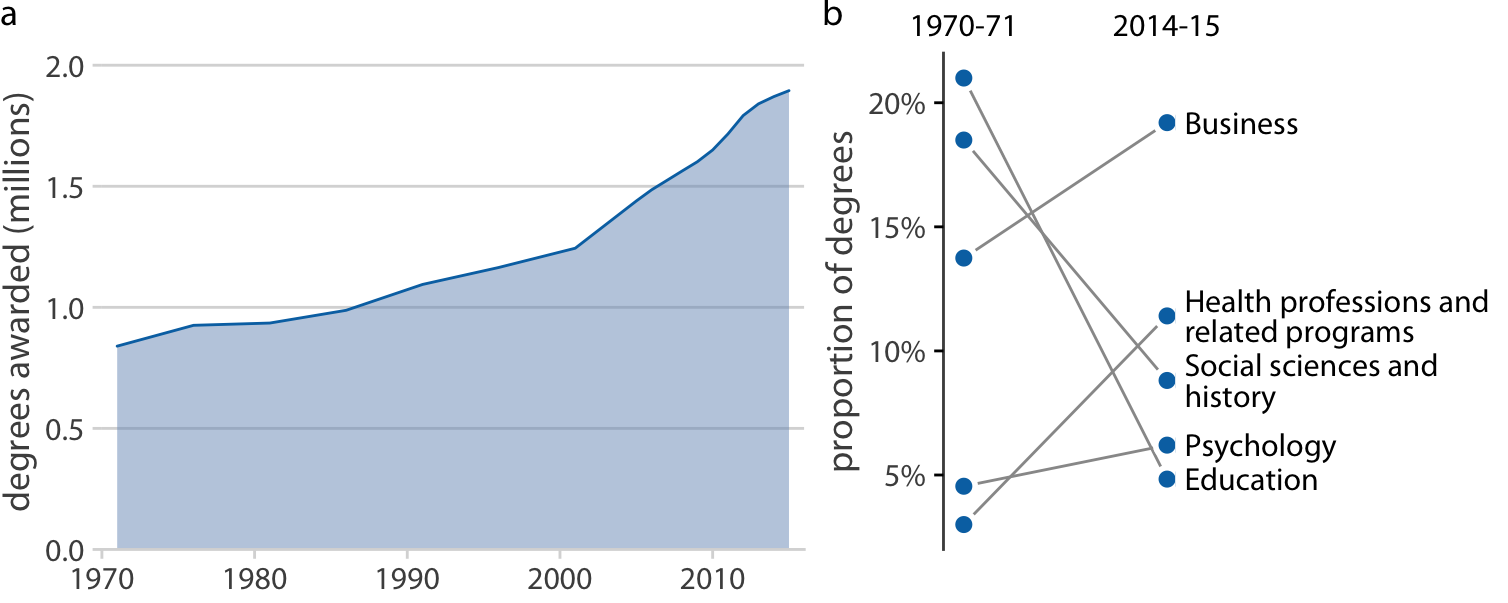
Combining disparate figures into one display
Don’t use overly large or otherwise prominent labels
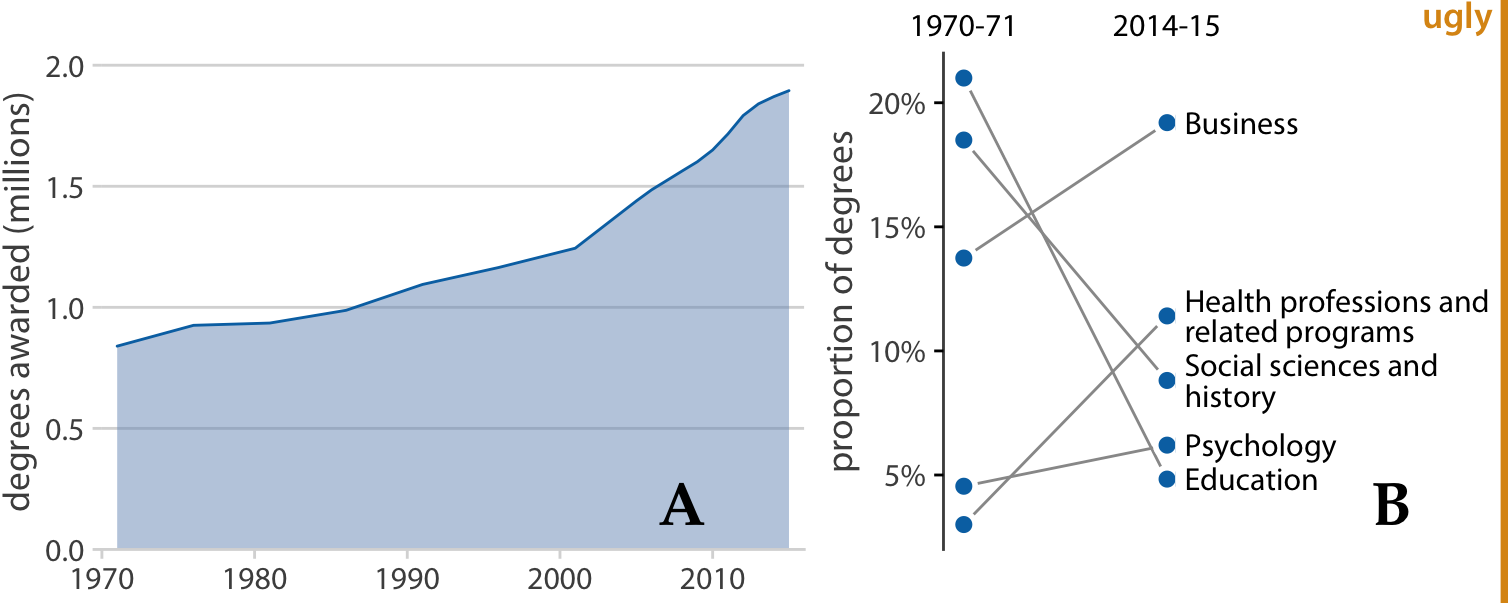
Note: Also don’t use serif fonts (such as Times) for labels
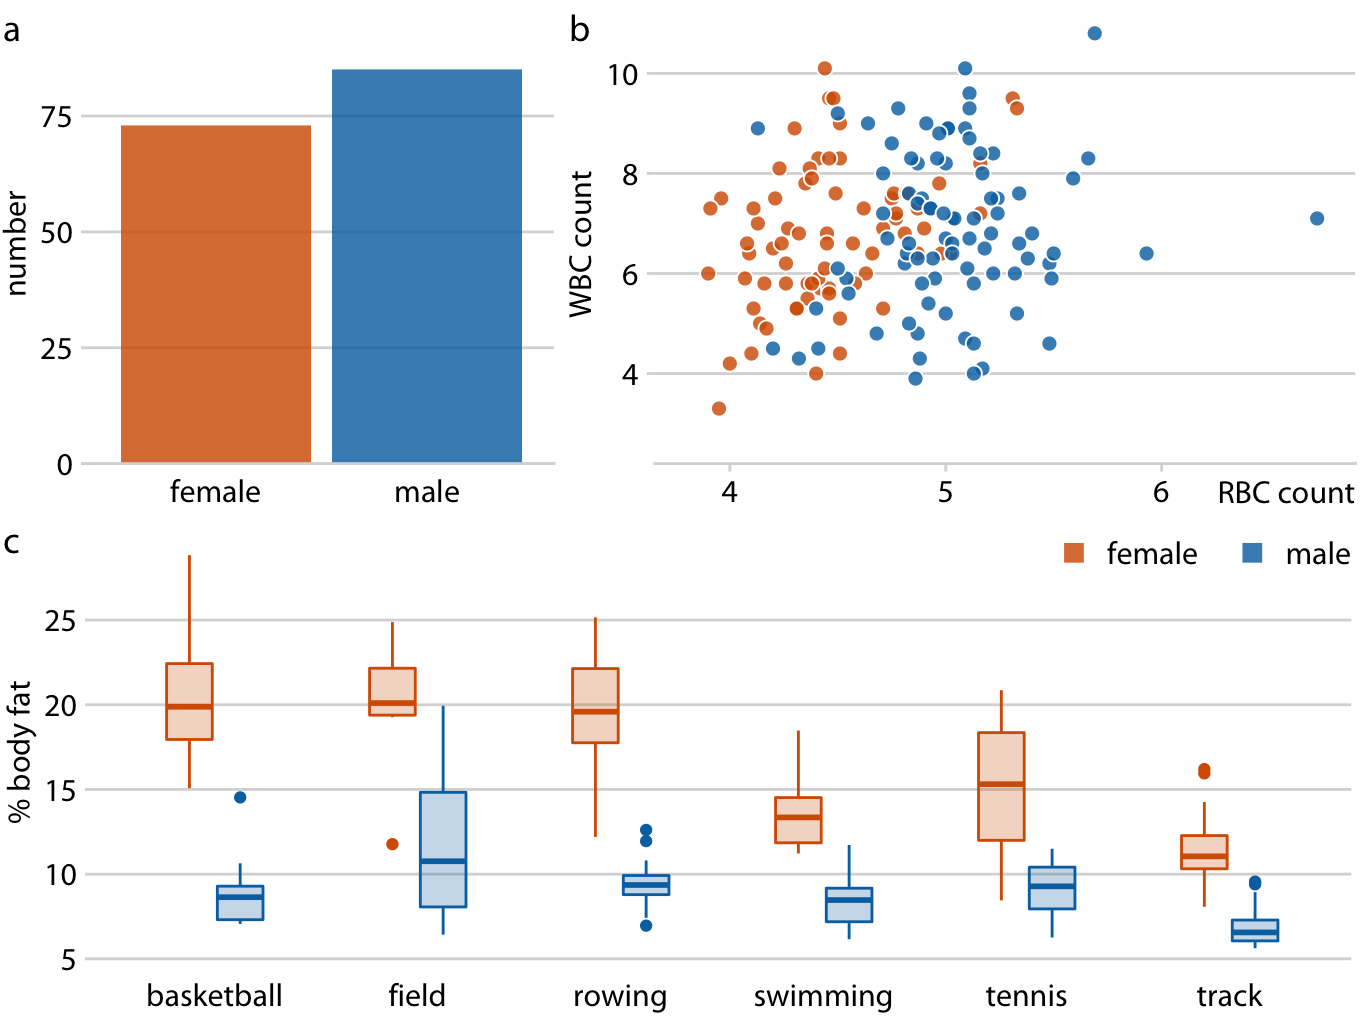
Use a consistent color language among sub-plots
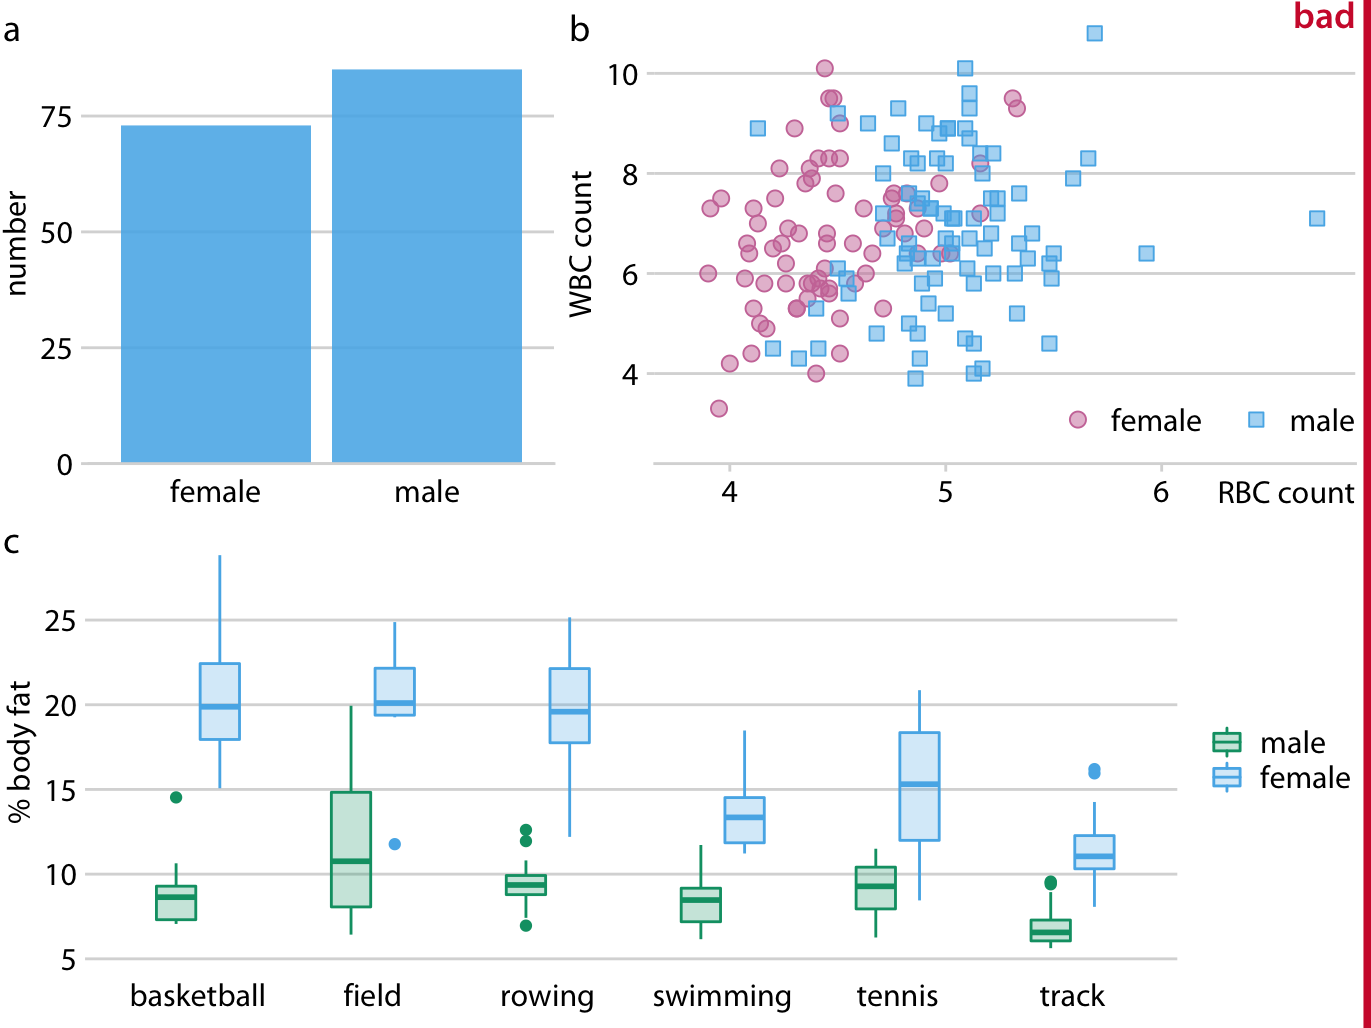
Use a consistent color language among sub-plots
Pay attention to sub-plot alignment
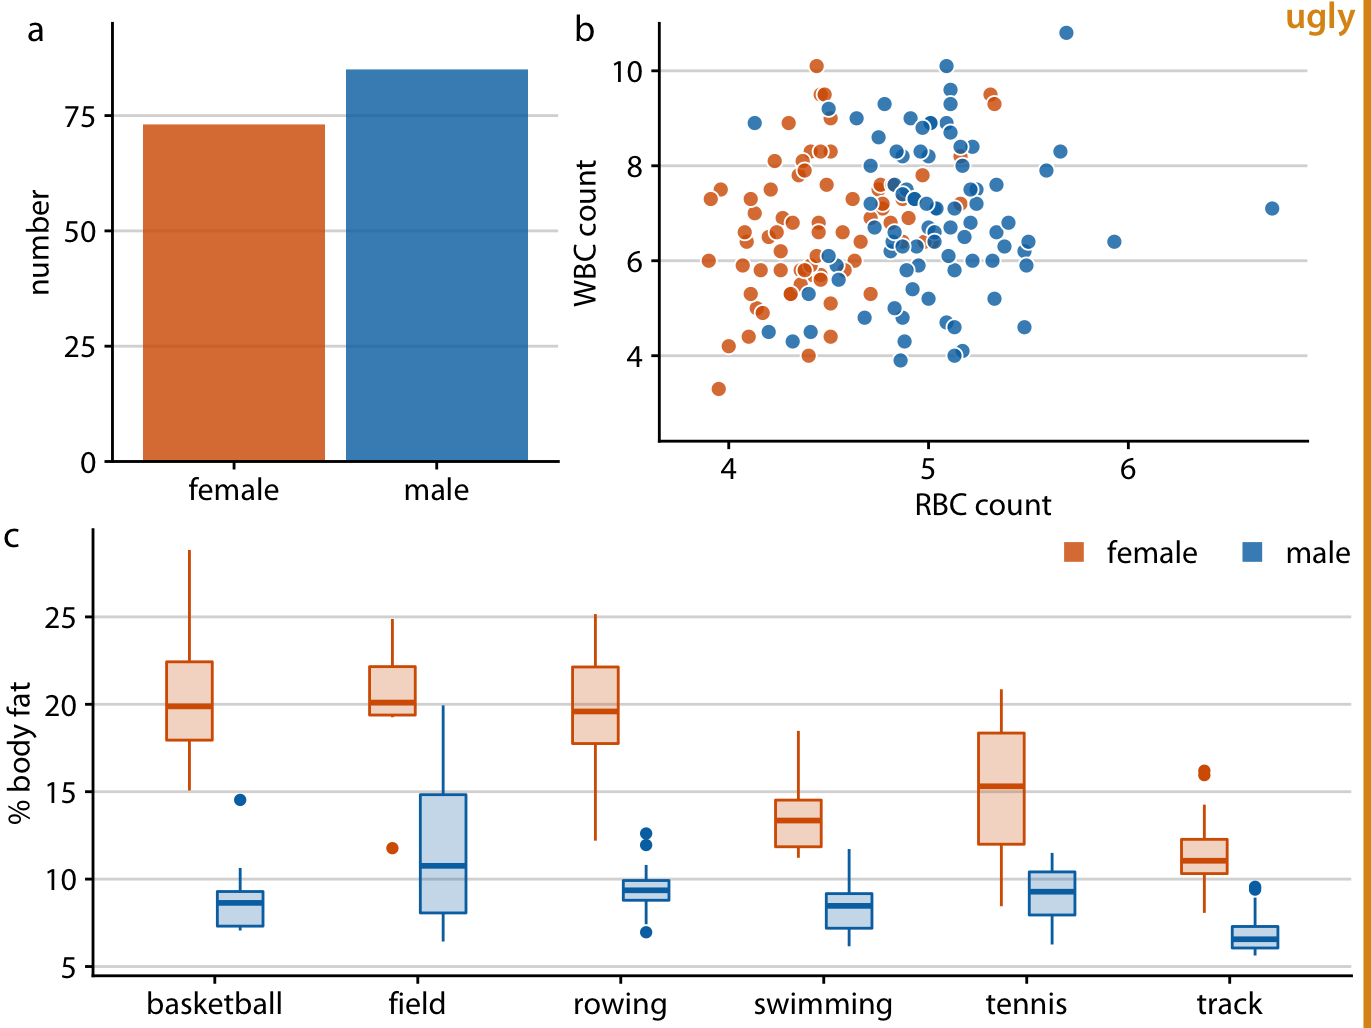
Pay attention to sub-plot alignment
Combine plots of different types
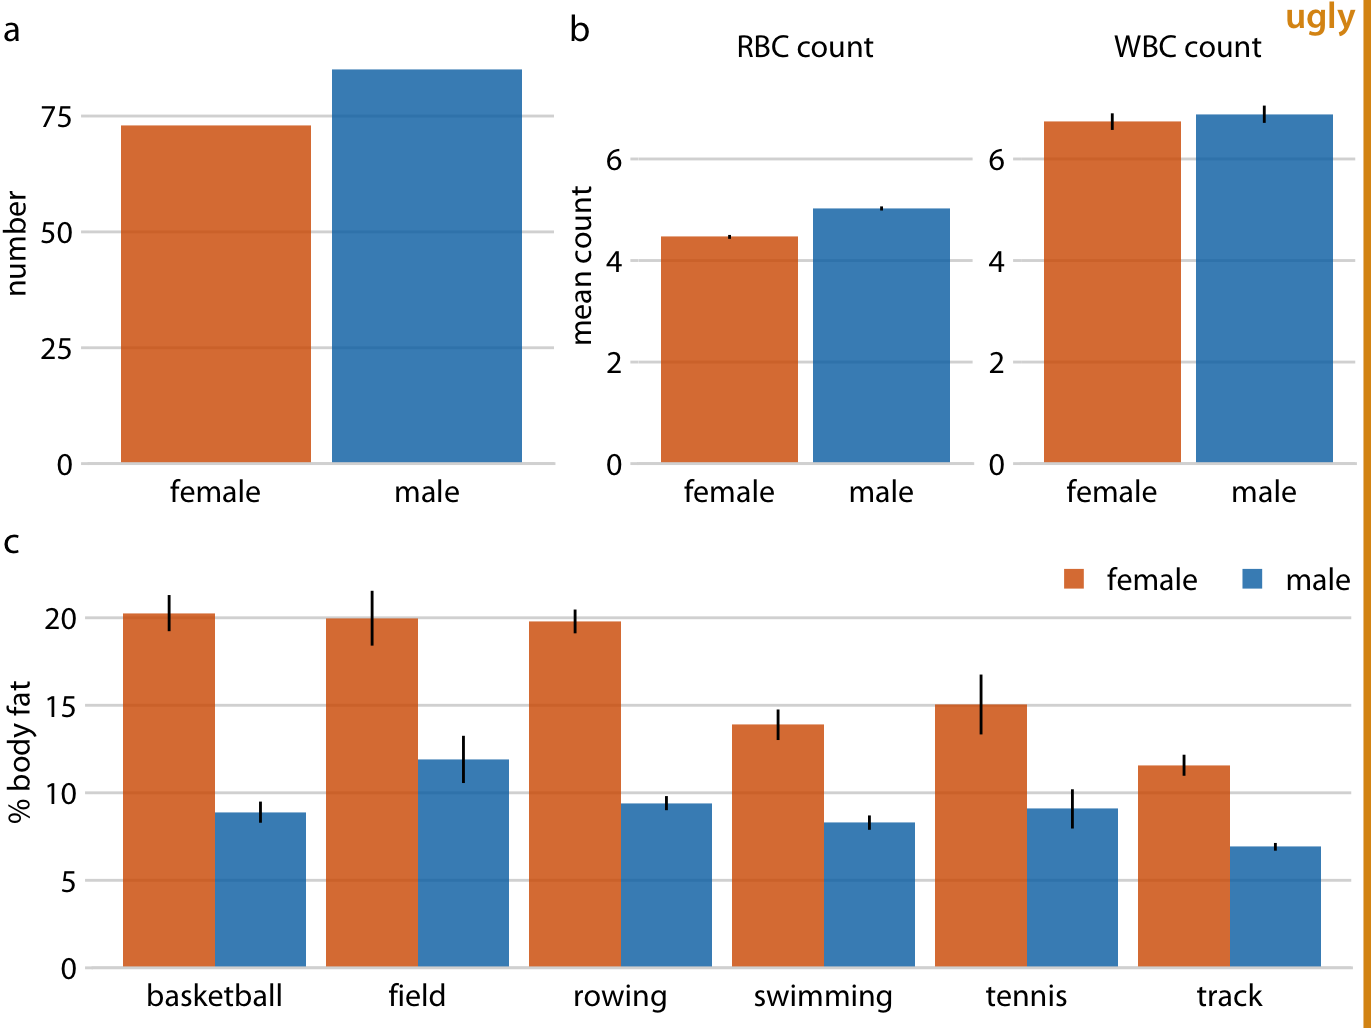
This helps your readers to distinguish different parts of the analysis
Combine plots of different types
This helps your readers to distinguish different parts of the analysis
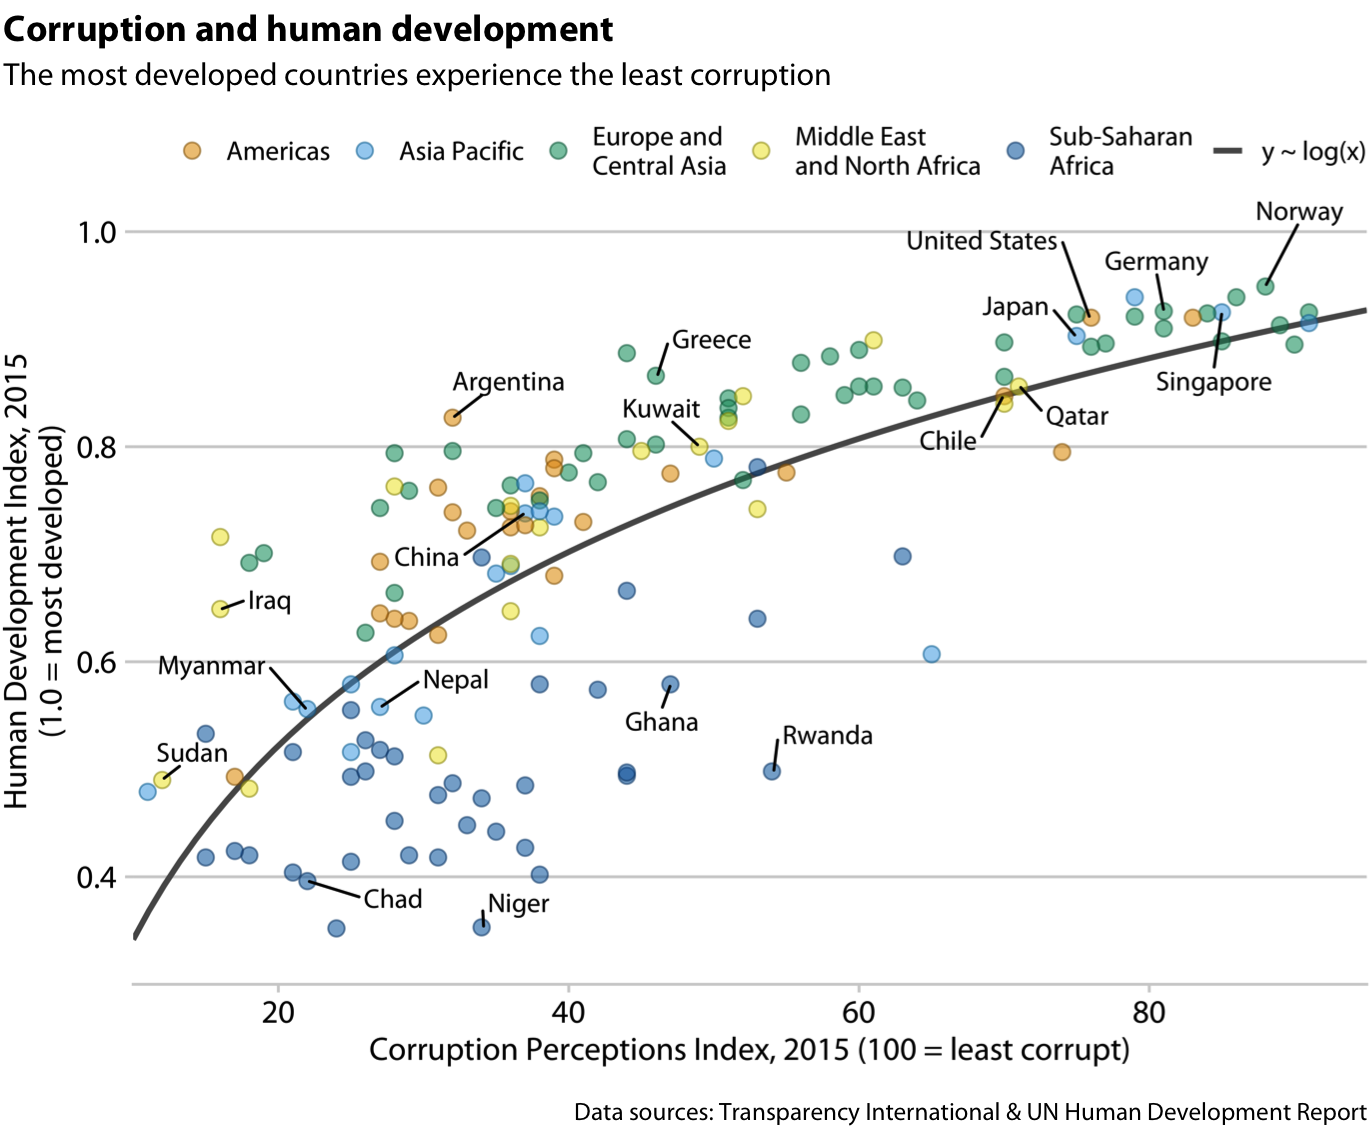
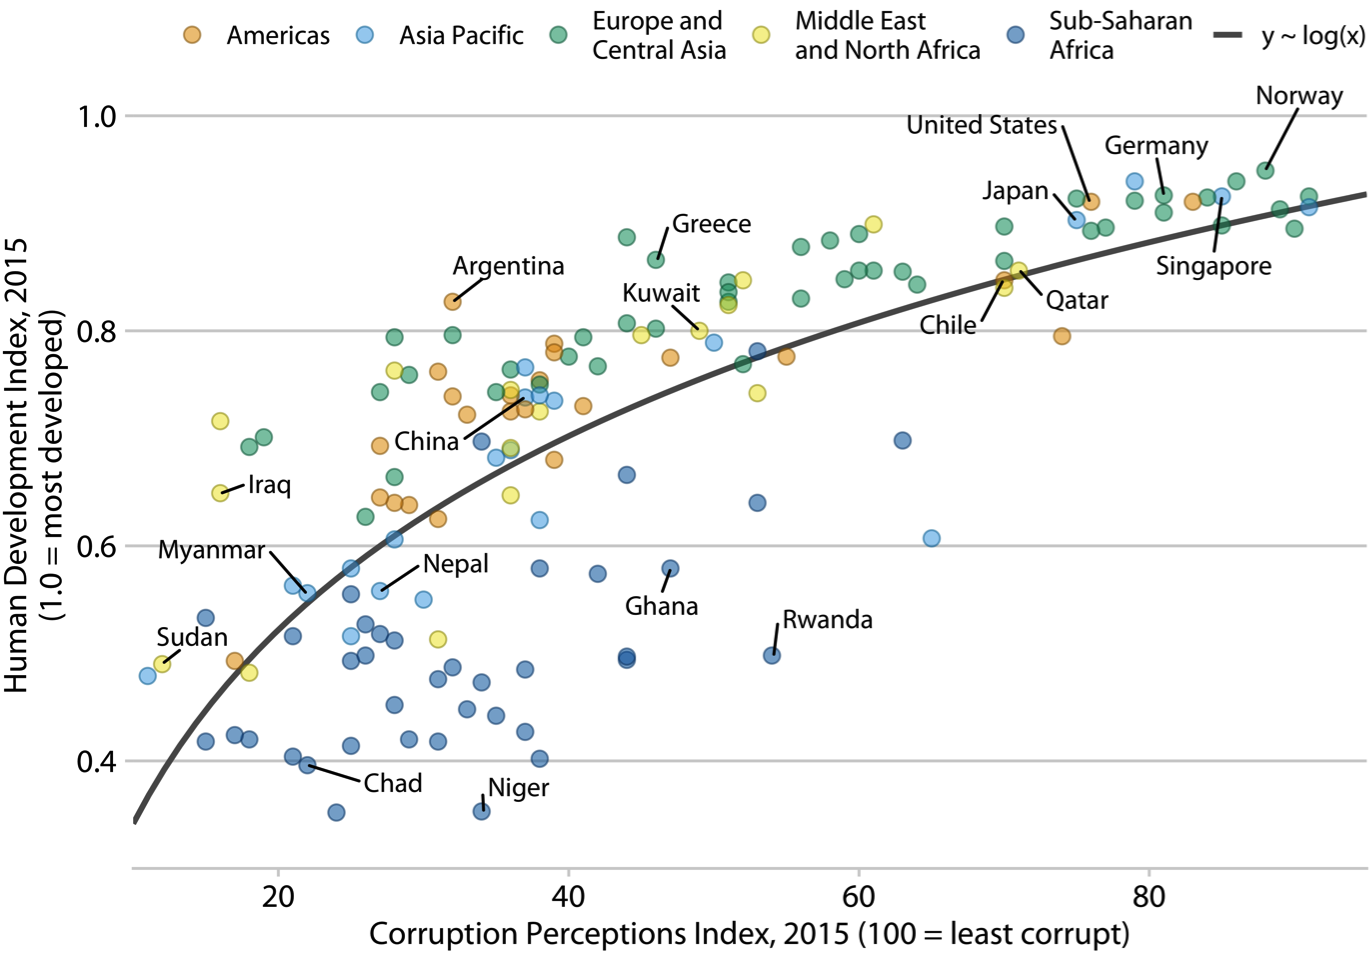
Figure 1. Corruption and human development. The most developed countries experience the least corruption. Inspired by a posting in The Economist online (2011). Data sources: Transparency International & UN Human Development Report.
Example of figure in article or book
The patchwork package

The patchwork package

The patchwork package

The patchwork package

The patchwork package

Plot annotations and themes

Automatic labeling of plots
Plot annotations and themes

Automatic labeling of plots
Plot annotations and themes

Applying one theme to all plots
Plot annotations and themes

Titles and captions