The geoms geom_hpline() and geom_vpline() can be used as a drop-in
replacement for geom_point() but draw horizontal or vertical lines
(point-lines, or plines) instead of points. These lines can often be useful to
indicate specific parameter estimates in a plot. The geoms take position
aesthetics as x and y like geom_point(), and they use width or height
to set the length of the line segment. All other aesthetics (colour, size,
linetype, etc.) are inherited from geom_segment().
geom_hpline(mapping = NULL, data = NULL, stat = "identity",
  position = "identity", ..., na.rm = FALSE, show.legend = NA,
  inherit.aes = TRUE)

geom_vpline(mapping = NULL, data = NULL, stat = "identity",
  position = "identity", ..., na.rm = FALSE, show.legend = NA,
  inherit.aes = TRUE)
Arguments
| mapping | Set of aesthetic mappings created by |
|---|---|
| data | The data to be displayed in this layer. There are three options: If A A |
| stat | The statistical transformation to use on the data for this layer, as a string. |
| position | Position adjustment, either as a string, or the result of a call to a position adjustment function. |
| ... | Other arguments passed on to |
| na.rm | If |
| show.legend | logical. Should this layer be included in the legends?
|
| inherit.aes | If |
Examples
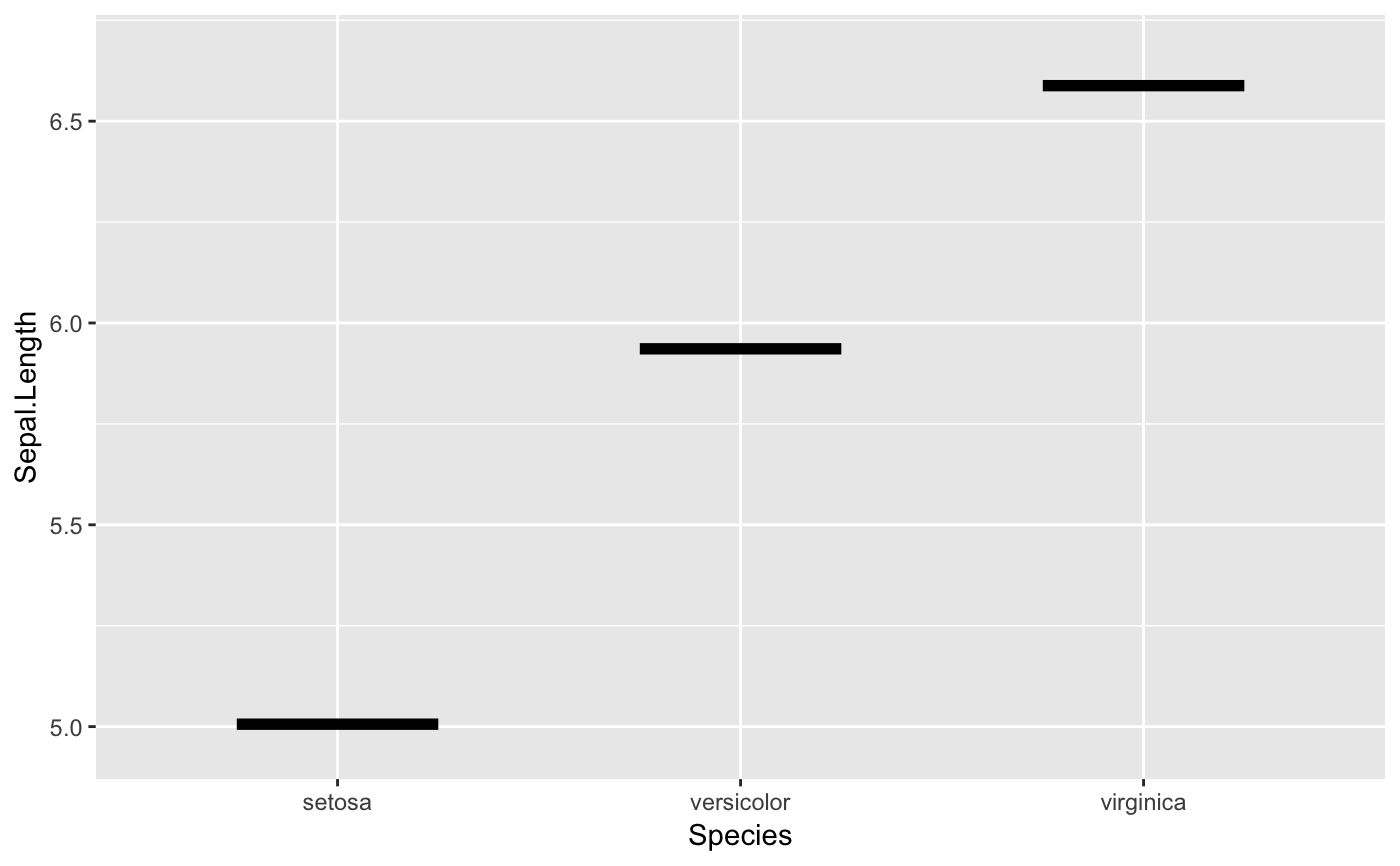
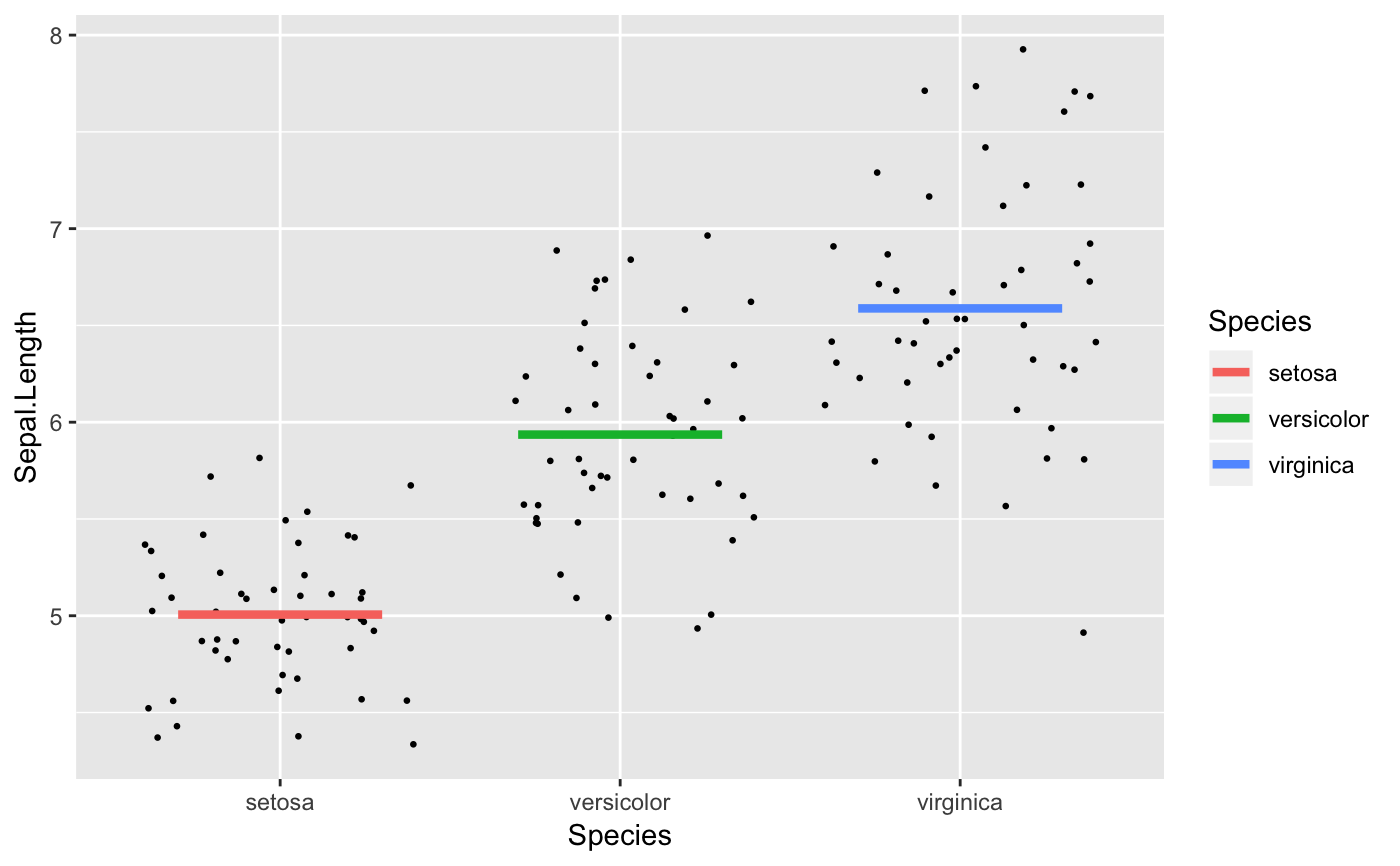
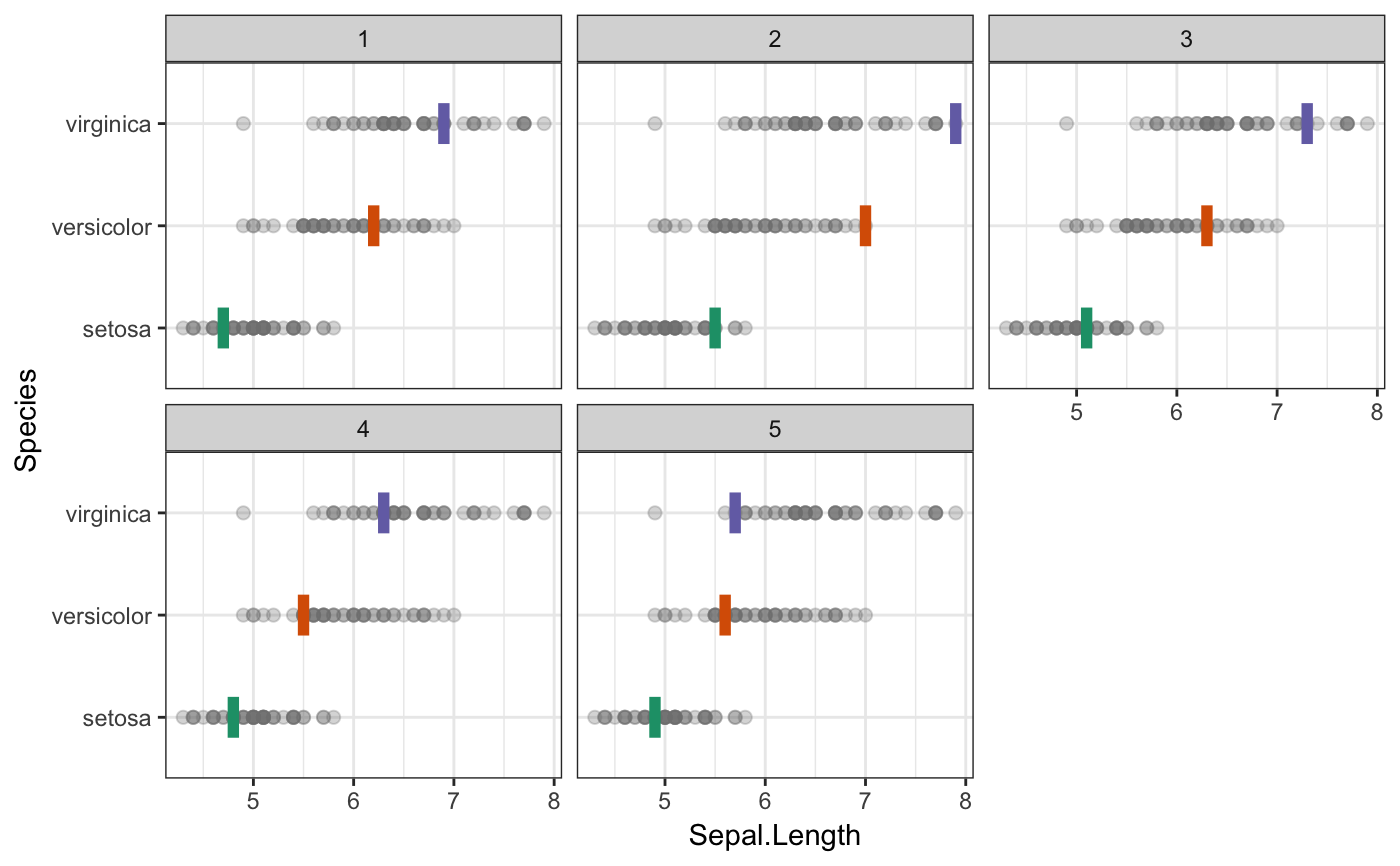
#>ggplot(iris, aes(Species, Sepal.Length)) + geom_point(position = "jitter", size = 0.5) + stat_summary(aes(colour = Species), geom = "hpline", width = 0.6, size = 1.5)#>ggplot(iris, aes(Sepal.Length, Species, color = Species)) + geom_point(color = "grey50", alpha = 0.3, size = 2) + geom_vpline(data = sampler(5, 1, group = Species), height = 0.4) + scale_color_brewer(type = "qual", palette = 2, guide = "none") + facet_wrap(~.draw) + theme_bw()


