The ggtext package provides simple Markdown and HTML rendering for ggplot2. Under the hood, the package uses the gridtext package for the actual rendering, and consequently it is limited to the feature set provided by gridtext.
Support is provided for Markdown both in theme elements (plot titles, subtitles, captions, axis labels, legends, etc.) and in geoms (similar to geom_text()). In both cases, there are two alternatives, one for creating simple text labels and one for creating text boxes with word wrapping.
Importantly, the gridtext package that provides the rendering support implements only an extremely limited subset of Markdown/HTML/CSS. It currently can make text bold or italics, can change the font, color, or size of a piece of text, can place text as sub- or superscript, and has extremely rudimentary image support. No other features are currently supported. As a general rule, any Markdown, HTML, or CSS feature that isn’t shown in any of the ggtext or gridtext documentation likely doesn’t exist.
Installation
You can install the latest stable release from CRAN via install.packages():
install.packages("ggtext")To install the latest development version of this package, please run the following line in your R console:
remotes::install_github("wilkelab/ggtext")Markdown in theme elements
The ggtext package defines two new theme elements, element_markdown() and element_textbox(). Both behave similarly to element_text() but render the provided text as markdown/html. element_markdown() is meant as a direct replacement for element_text(), and it renders text without word wrapping. To start a new line, use the <br> tag or add two spaces before the end of a line.
As an example, we can mix regular, italics, and bold text, and we can also apply colors to axis tick labels. This particular example was inspired by this stackoverflow post.
library(tidyverse)
library(ggtext)
library(glue)

data <- tibble(
  bactname = c("Staphylococcaceae", "Moraxella", "Streptococcus", "Acinetobacter"),
  OTUname = c("OTU 1", "OTU 2", "OTU 3", "OTU 4"),
  value = c(-0.5, 0.5, 2, 3)
)

data %>% mutate(
  color = c("#009E73", "#D55E00", "#0072B2", "#000000"),
  name = glue("<i style='color:{color}'>{bactname}</i> ({OTUname})"),
  name = fct_reorder(name, value)
)  %>%
  ggplot(aes(value, name, fill = color)) +
  geom_col(alpha = 0.5) +
  scale_fill_identity() +
  labs(caption = "Example posted on **stackoverflow.com**<br>(using made-up data)") +
  theme(
    axis.text.y = element_markdown(),
    plot.caption = element_markdown(lineheight = 1.2)
  )
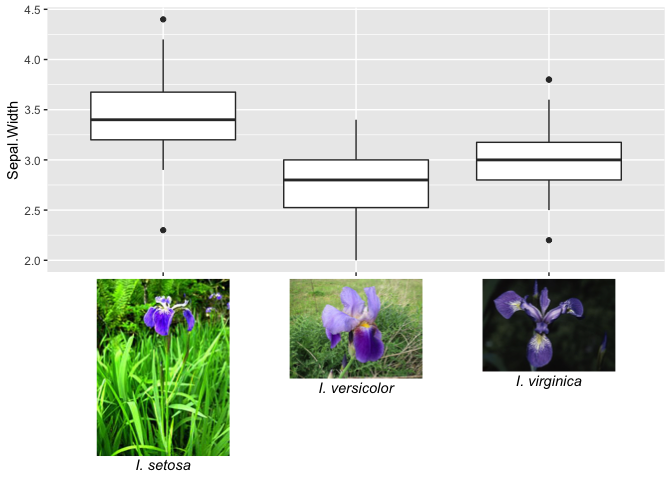
Very basic support for the <img> tag exists, and it can be used, for example, to employ images as axis labels.
labels <- c(
  setosa = "<img src='https://upload.wikimedia.org/wikipedia/commons/thumb/8/86/Iris_setosa.JPG/180px-Iris_setosa.JPG'
    width='100' /><br>*I. setosa*",
  virginica = "<img src='https://upload.wikimedia.org/wikipedia/commons/thumb/3/38/Iris_virginica_-_NRCS.jpg/320px-Iris_virginica_-_NRCS.jpg'
    width='100' /><br>*I. virginica*",
  versicolor = "<img src='https://upload.wikimedia.org/wikipedia/commons/thumb/2/27/20140427Iris_versicolor1.jpg/320px-20140427Iris_versicolor1.jpg'
    width='100' /><br>*I. versicolor*"
)

ggplot(iris, aes(Species, Sepal.Width)) +
  geom_boxplot() +
  scale_x_discrete(
    name = NULL,
    labels = labels
  ) +
  theme(
    axis.text.x = element_markdown(color = "black", size = 11)
  )
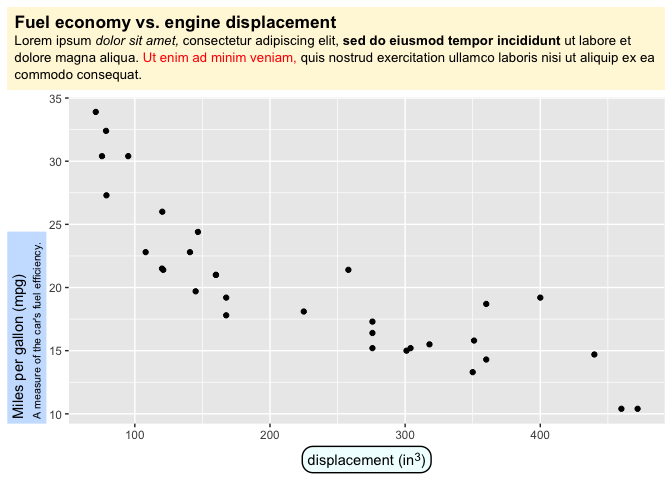
element_textbox() offers support for rendering larger amounts of text that require word wrapping. Unlike element_markdown(), it cannot be used for axis tick labels, and it cannot draw text at arbitrary angles, only at fixed orientations corresponding to 0, 90, 180, and 270 degrees. In practice, you will usually want to use element_textbox_simple() instead of element_textbox(), as it sets useful defaults for many parameters not usually defined in ggplot2 themes.
ggplot(mtcars, aes(disp, mpg)) +
  geom_point() +
  labs(
    title = "<b>Fuel economy vs. engine displacement</b><br>
    <span style = 'font-size:10pt'>Lorem ipsum *dolor sit amet,*
    consectetur adipiscing elit, **sed do eiusmod tempor incididunt** ut
    labore et dolore magna aliqua. <span style = 'color:red;'>Ut enim
    ad minim veniam,</span> quis nostrud exercitation ullamco laboris nisi
    ut aliquip ex ea commodo consequat.</span>",
    x = "displacement (in<sup>3</sup>)",
    y = "Miles per gallon (mpg)<br><span style = 'font-size:8pt'>A measure of
    the car's fuel efficiency.</span>"
  ) +
  theme(
    plot.title.position = "plot",
    plot.title = element_textbox_simple(
      size = 13,
      lineheight = 1,
      padding = margin(5.5, 5.5, 5.5, 5.5),
      margin = margin(0, 0, 5.5, 0),
      fill = "cornsilk"
    ),
    axis.title.x = element_textbox_simple(
      width = NULL,
      padding = margin(4, 4, 4, 4),
      margin = margin(4, 0, 0, 0),
      linetype = 1,
      r = grid::unit(8, "pt"),
      fill = "azure1"
    ),
    axis.title.y = element_textbox_simple(
      hjust = 0,
      orientation = "left-rotated",
      minwidth = unit(1, "in"),
      maxwidth = unit(2, "in"),
      padding = margin(4, 4, 2, 4),
      margin = margin(0, 0, 2, 0),
      fill = "lightsteelblue1"
    )
  )
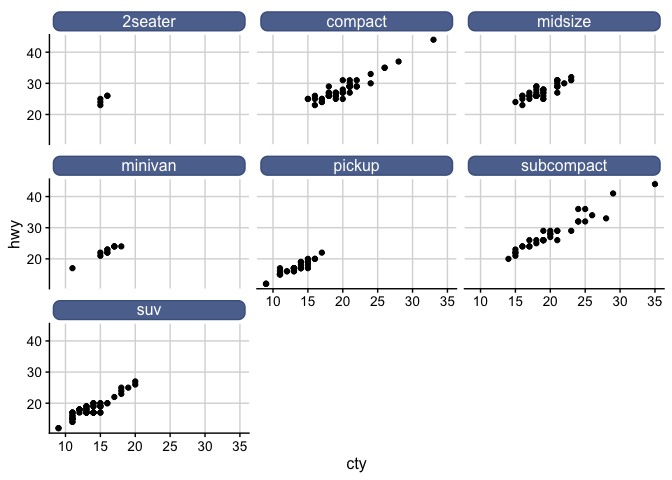
Another example, replacing facet strips with text boxes.
library(cowplot)

ggplot(mpg, aes(cty, hwy)) +
  geom_point() +
  facet_wrap(~class) +
  theme_half_open(12) +
  background_grid() +
  theme(
    strip.background = element_blank(),
    strip.text = element_textbox(
      size = 12,
      color = "white", fill = "#5D729D", box.color = "#4A618C",
      halign = 0.5, linetype = 1, r = unit(5, "pt"), width = unit(1, "npc"),
      padding = margin(2, 0, 1, 0), margin = margin(3, 3, 3, 3)
    )
  )
Geoms
The geom geom_richtext() provides markdown/html labels. Unlike geom_label(), the labels can be rotated.
df <- tibble(
  label = c(
    "Some text **in bold.**",
    "Linebreaks<br>Linebreaks<br>Linebreaks",
    "*x*<sup>2</sup> + 5*x* + *C*<sub>*i*</sub>",
    "Some <span style='color:blue'>blue text **in bold.**</span><br>And *italics text.*<br>
    And some <span style='font-size:18pt; color:black'>large</span> text."
  ),
  x = c(.2, .1, .5, .9),
  y = c(.8, .4, .1, .5),
  hjust = c(0.5, 0, 0, 1),
  vjust = c(0.5, 1, 0, 0.5),
  angle = c(0, 0, 45, -45),
  color = c("black", "blue", "black", "red"),
  fill = c("cornsilk", "white", "lightblue1", "white")
)


ggplot(df) +
  aes(
    x, y, label = label, angle = angle, color = color, fill = fill,
    hjust = hjust, vjust = vjust
  ) +
  geom_richtext() +
  geom_point(color = "black", size = 2) +
  scale_color_identity() +
  scale_fill_identity() +
  xlim(0, 1) + ylim(0, 1)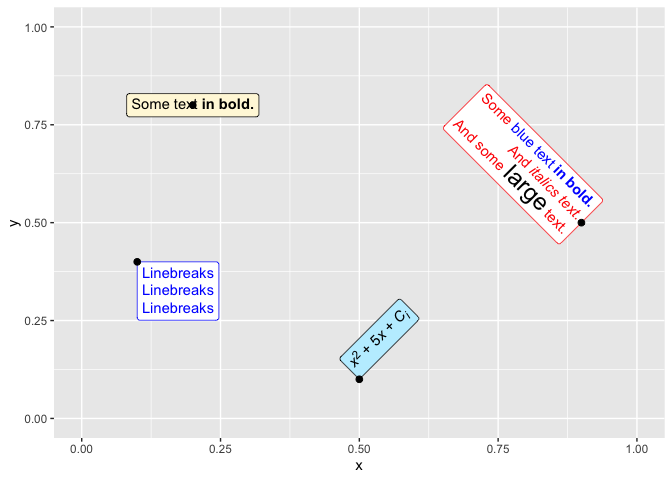
Labels without frame or background are also possible.
ggplot(df) +
  aes(
    x, y, label = label, angle = angle, color = color,
    hjust = hjust, vjust = vjust
  ) +
  geom_richtext(
    fill = NA, label.color = NA, # remove background and outline
    label.padding = grid::unit(rep(0, 4), "pt") # remove padding
  ) +
  geom_point(color = "black", size = 2) +
  scale_color_identity() +
  xlim(0, 1) + ylim(0, 1)
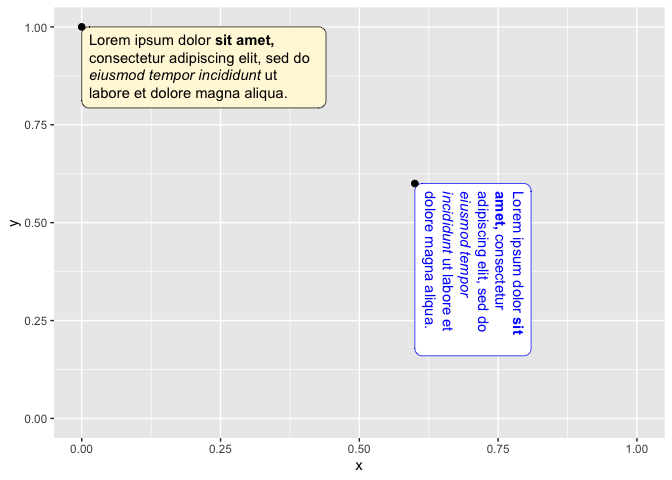
The geom geom_textbox() can draw boxes with word-wrapped text. It does not support arbitrary rotation angles, only fixed orientations, just like element_textbox().
df <- tibble(
  label = rep("Lorem ipsum dolor **sit amet,** consectetur adipiscing elit,
    sed do *eiusmod tempor incididunt* ut labore et dolore magna
    aliqua.", 2),
  x = c(0, .6),
  y = c(1, .6),
  hjust = c(0, 0),
  vjust = c(1, 0),
  orientation = c("upright", "right-rotated"),
  color = c("black", "blue"),
  fill = c("cornsilk", "white")
)

ggplot(df) +
  aes(
    x, y, label = label, color = color, fill = fill,
    hjust = hjust, vjust = vjust,
    orientation = orientation
  ) +
  geom_textbox(width = unit(0.4, "npc")) +
  geom_point(color = "black", size = 2) +
  scale_discrete_identity(aesthetics = c("color", "fill", "orientation")) +
  xlim(0, 1) + ylim(0, 1)