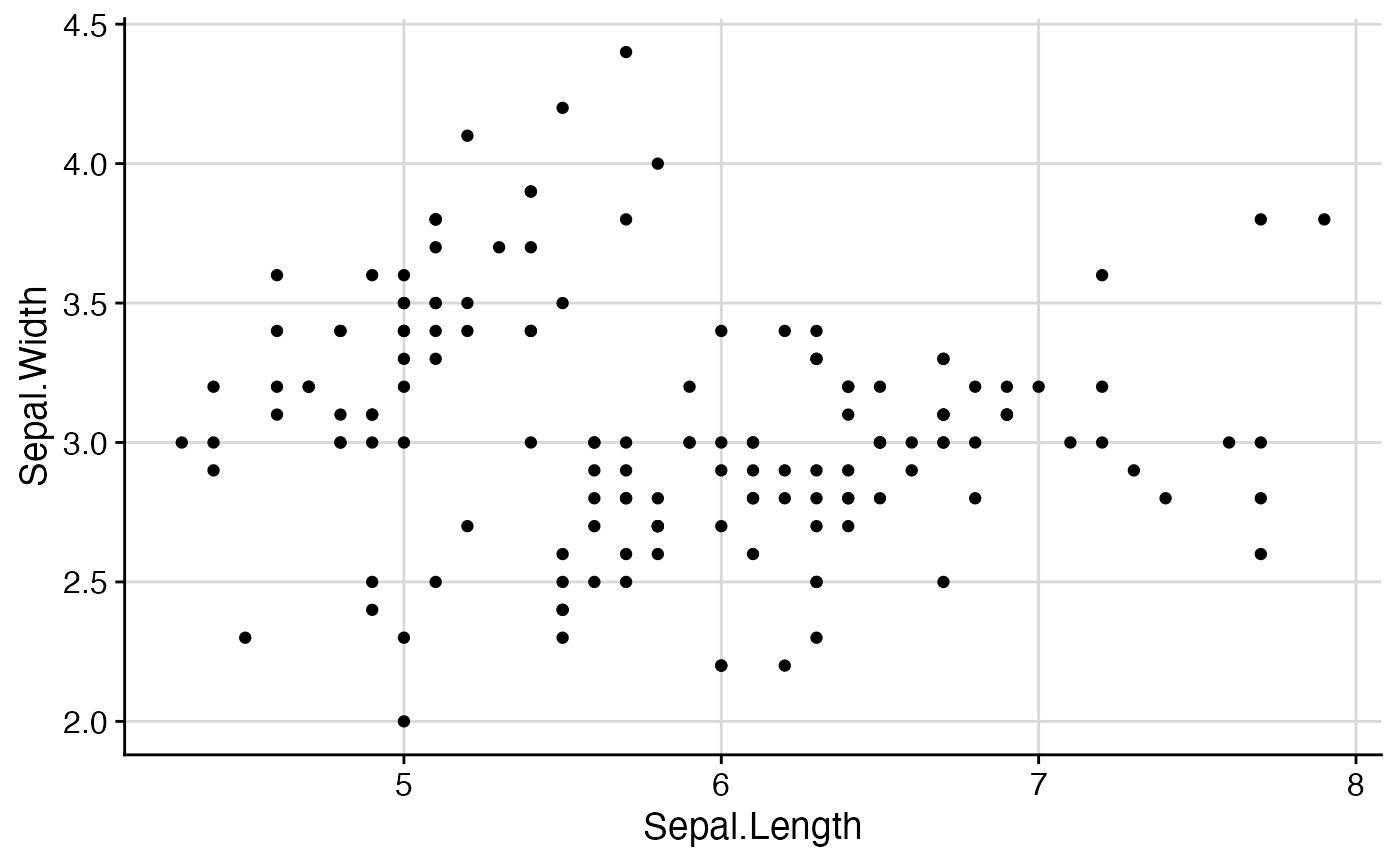
This function provides a simple way to set the background grid in ggplot2. It
doesn't do anything that can't be done just the same with ggplot2::theme(). However, it simplifies
creation of the most commonly needed variations.
Arguments
- major
Specifies along which axes you would like to plot major grid lines. Options are "xy", "x", "y", "none".
- minor
Specifies along which axes you would like to plot minor grid lines. Options are "xy", "x", "y", "none".
- size.major
Size of the major grid lines.
- size.minor
Size of the minor grid lines.
- color.major, colour.major
Color of the major grid lines.
- color.minor, colour.minor
Color of the minor grid lines.
Details
Note: This function completely overwrites all background grid settings of the current theme. If that
is not what you want, you may be better off using ggplot2::theme() directly.
Examples
library(ggplot2)

ggplot(iris, aes(Sepal.Length, Sepal.Width)) +
 geom_point() +
 theme_half_open() +
 background_grid()
