This function extracts just the legend from a ggplot
get_legend(plot, legend = NULL)Arguments
Value
A gtable object holding just the legend or NULL if there is no legend.
Examples
library(ggplot2)
p <- ggplot(mpg) +
       aes(displ, hwy, color = factor(cyl), shape = factor(year)) +
       geom_point() +
       guides(shape = guide_legend(position = "bottom"))
p


# default settings retrieve the first legend
ggdraw(get_legend(p))

# retrieve the bottom legend
ggdraw(get_legend(p, legend = "bottom"))

# retrieve the right legend
ggdraw(get_legend(p, legend = "right"))


# example demonstrating plot alignment with legend
p1 <- ggplot(mtcars, aes(mpg, disp)) + geom_line()
plot.mpg <- ggplot(mpg, aes(x = cty, y = hwy, colour = factor(cyl))) + geom_point(size=2.5)
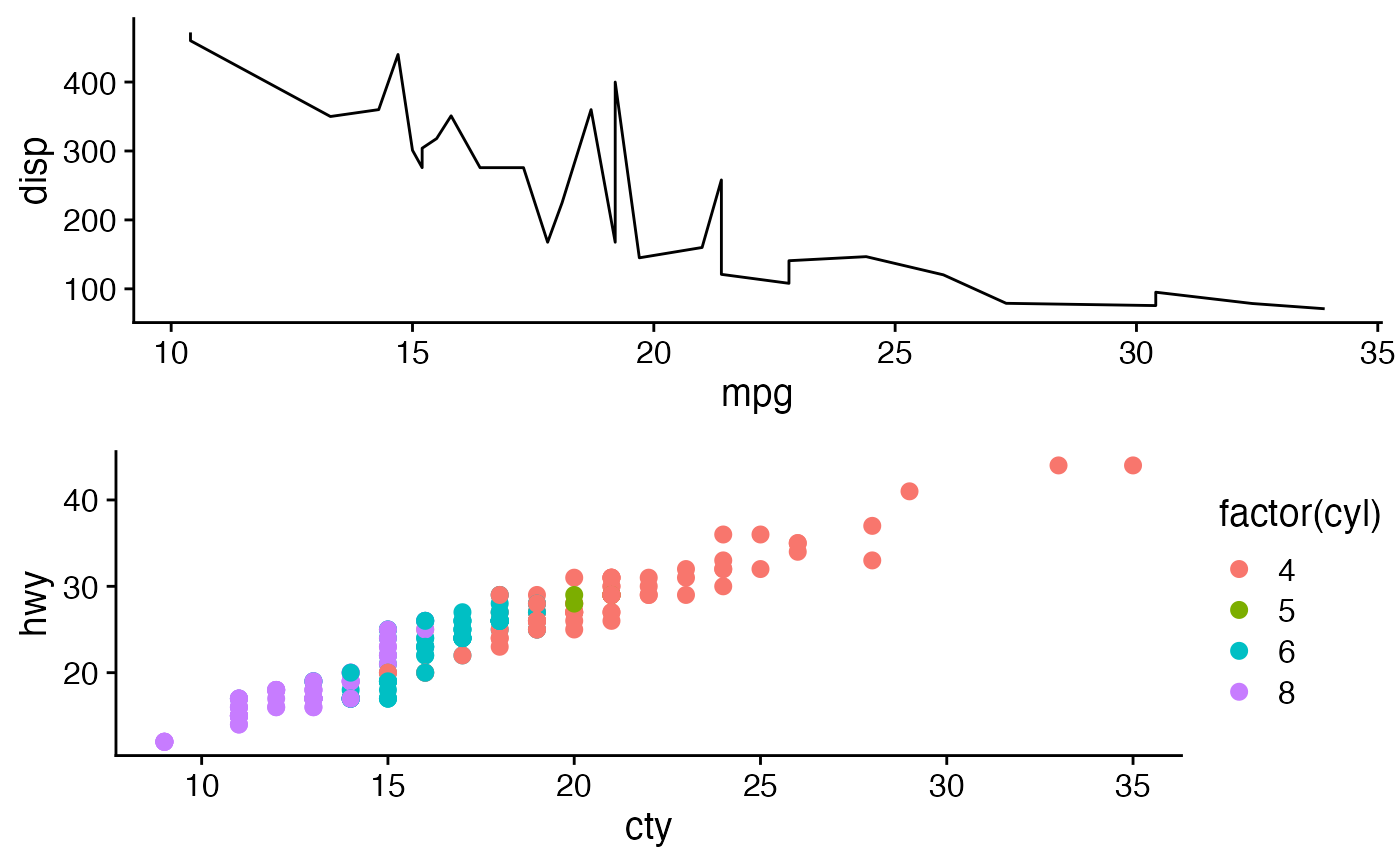
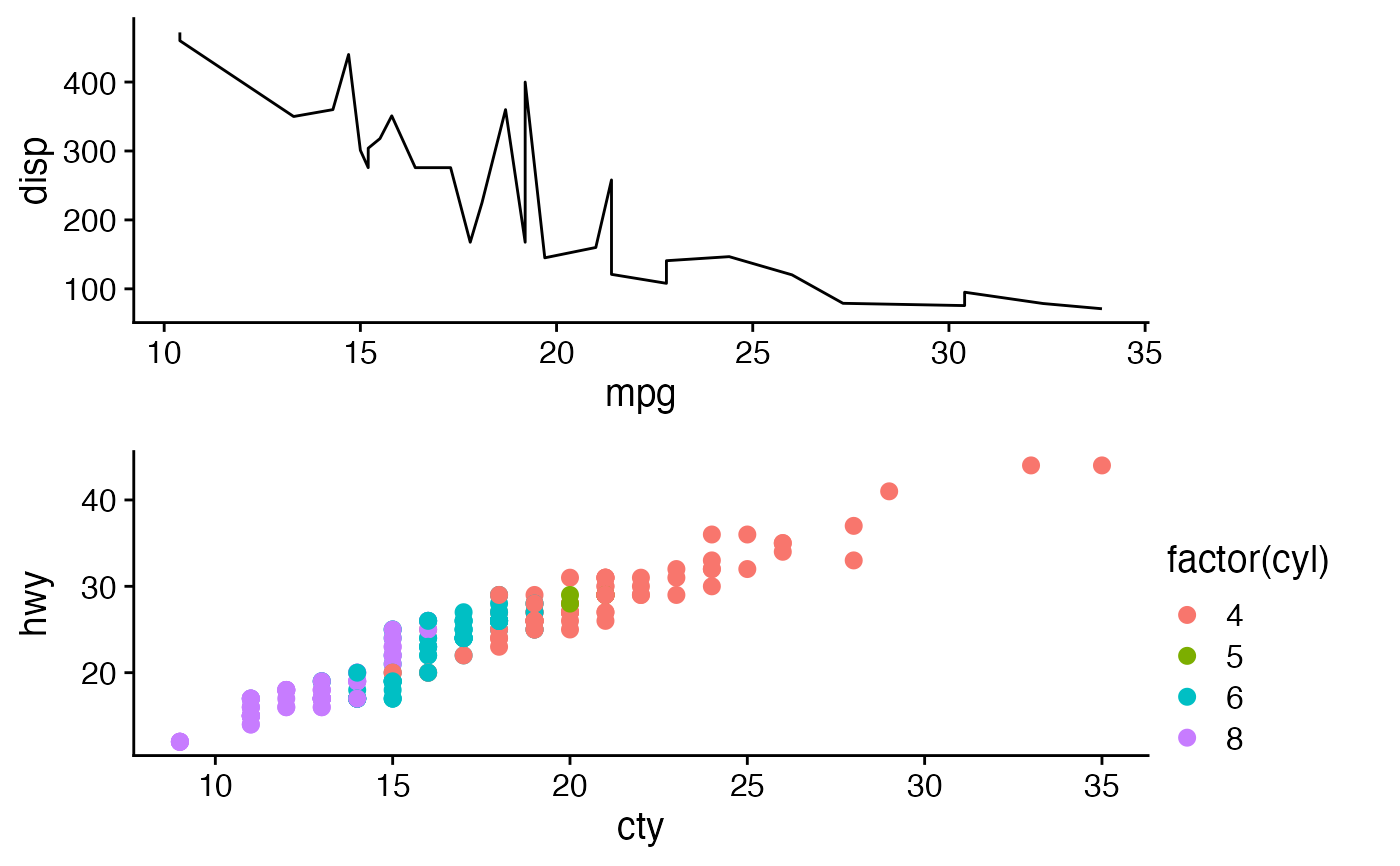
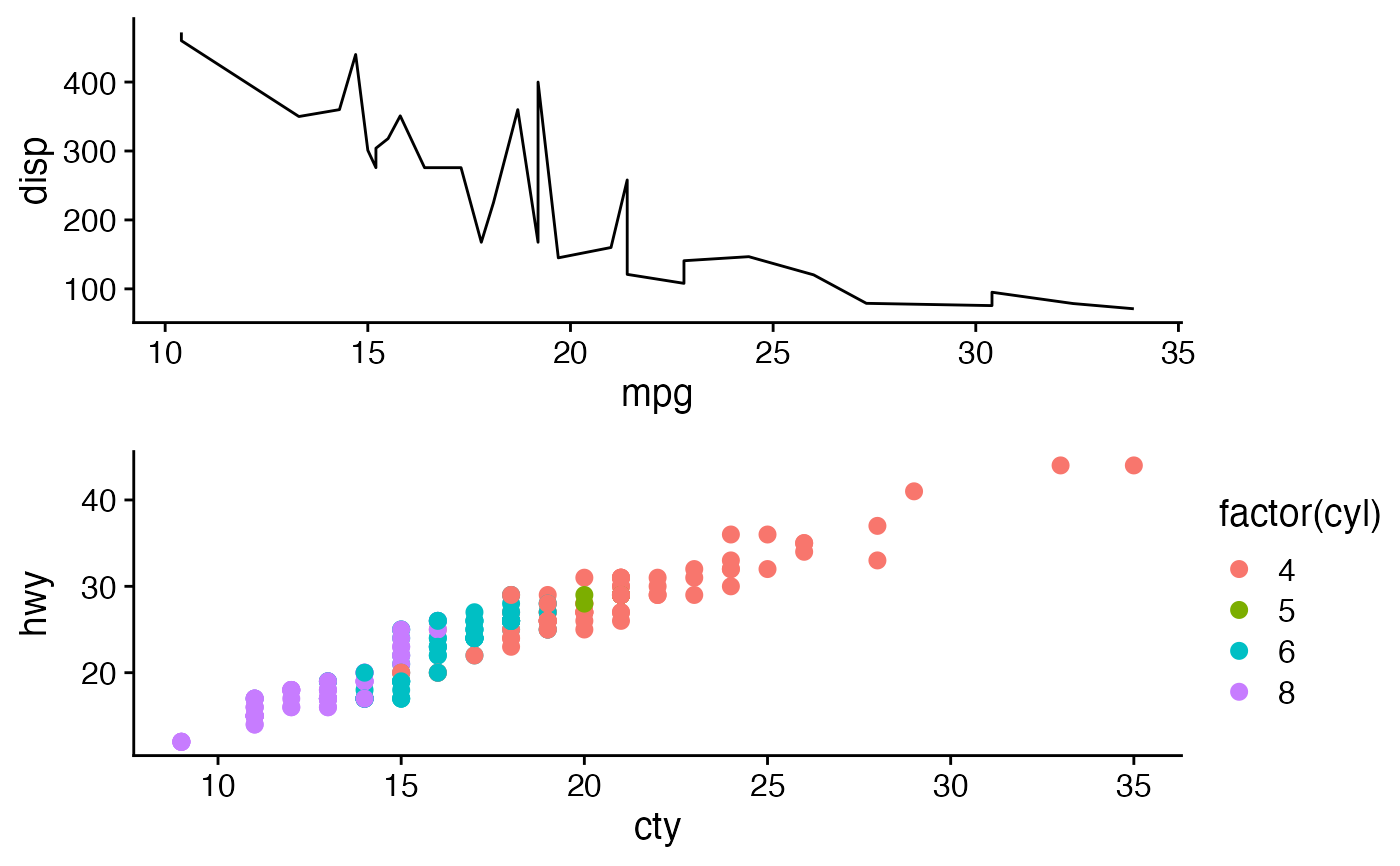
# note that these cannot be aligned vertically due to the legend in the plot.mpg
ggdraw(plot_grid(p1, plot.mpg, ncol=1, align='v'))


legend <- get_legend(plot.mpg)
plot.mpg <- plot.mpg + theme(legend.position='none')
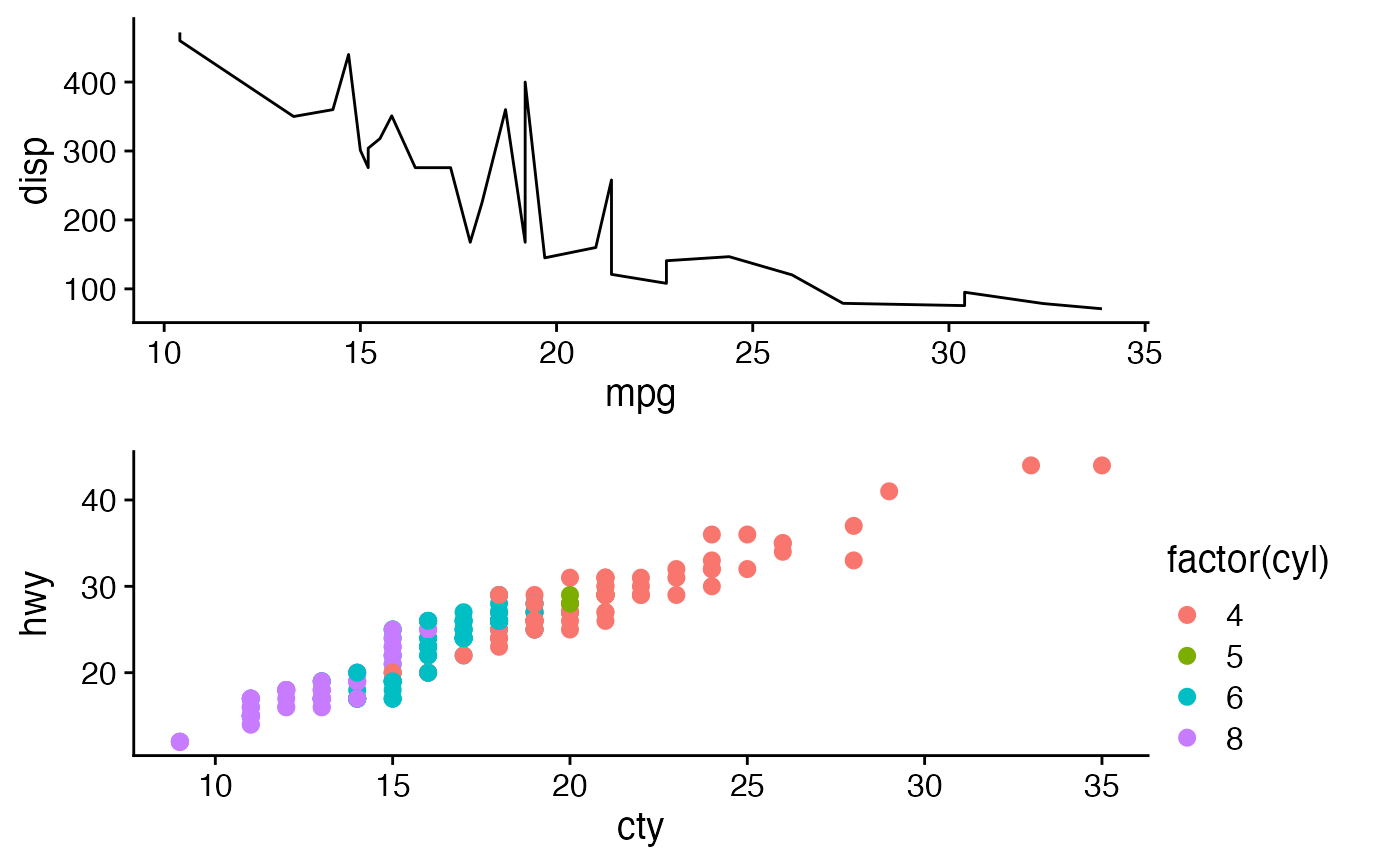
# now plots are aligned vertically with the legend to the right
ggdraw(plot_grid(plot_grid(p1, plot.mpg, ncol=1, align='v'),
                 plot_grid(NULL, legend, ncol=1),
                 rel_widths=c(1, 0.2)))
