Plots the sum of the x and width aesthetics versus y, filling the area between x and x + width with a color.
Just like geom_ridgeline(), but with y and x replaced.
Usage
geom_vridgeline(
  mapping = NULL,
  data = NULL,
  stat = "identity",
  position = "identity",
  na.rm = FALSE,
  show.legend = NA,
  inherit.aes = TRUE,
  ...
)
Arguments
- mapping
Set of aesthetic mappings created by
ggplot2::aes(). If specified andinherit.aes = TRUE(the default), it is combined with the default mapping at the top level of the plot. You must supplymappingif there is no plot mapping.- data
The data to be displayed in this layer. There are three options:
If
NULL, the default, the data is inherited from the plot data as specified in the call toggplot().A
data.frame, or other object, will override the plot data.A
functionwill be called with a single argument, the plot data. The return value must be adata.frame., and will be used as the layer data.- stat
The statistical transformation to use on the data for this layer, as a string.
- position
Position adjustment, either as a string, or the result of a call to a position adjustment function.
- na.rm
If
FALSE, the default, missing values are removed with a warning. IfTRUE, missing values are silently removed.- show.legend
logical. Should this layer be included in the legends?
NA, the default, includes if any aesthetics are mapped.FALSEnever includes, andTRUEalways includes.- inherit.aes
If
FALSE, overrides the default aesthetics, rather than combining with them.- ...
other arguments passed on to
ggplot2::layer(). These are often aesthetics, used to set an aesthetic to a fixed value, likecolor = "red"orlinewidth = 3. They may also be parameters to the paired geom/stat.
Aesthetics
Required aesthetics are in bold.
xywidthWidth of the ridgeline, measured from the respectivexvalue. Assumed to be positive, though this is not required.groupDefines the grouping. Required when the dataset contains multiple distinct ridgelines. Will typically be the same variable as is mapped tox.scaleA scaling factor to scale the widths of the ridgelines. A value of 1 indicates that the widths are taken as is. This aesthetic can be used to convertwidthunits intoxunits.min_widthA width cutoff on the drawn ridgelines. All values that fall below this cutoff will be removed. The main purpose of this cutoff is to remove long tails right at the baseline level, but other uses are possible. The cutoff is applied before any width scaling is applied via thescaleaesthetic. Default is 0, so negative values are removed.colorColor of the ridgelinefillFill color of the area under the ridgelinealphaTransparency level offill. Not applied tocolor. If you want transparent lines, you can set their color as RGBA value, e.g. #FF0000A0 for partially transparent red.groupGrouping, to draw multiple ridgelines from one datasetlinetypeLinetype of the ridgelinelinewidthLine thickness
Examples
library(ggplot2)
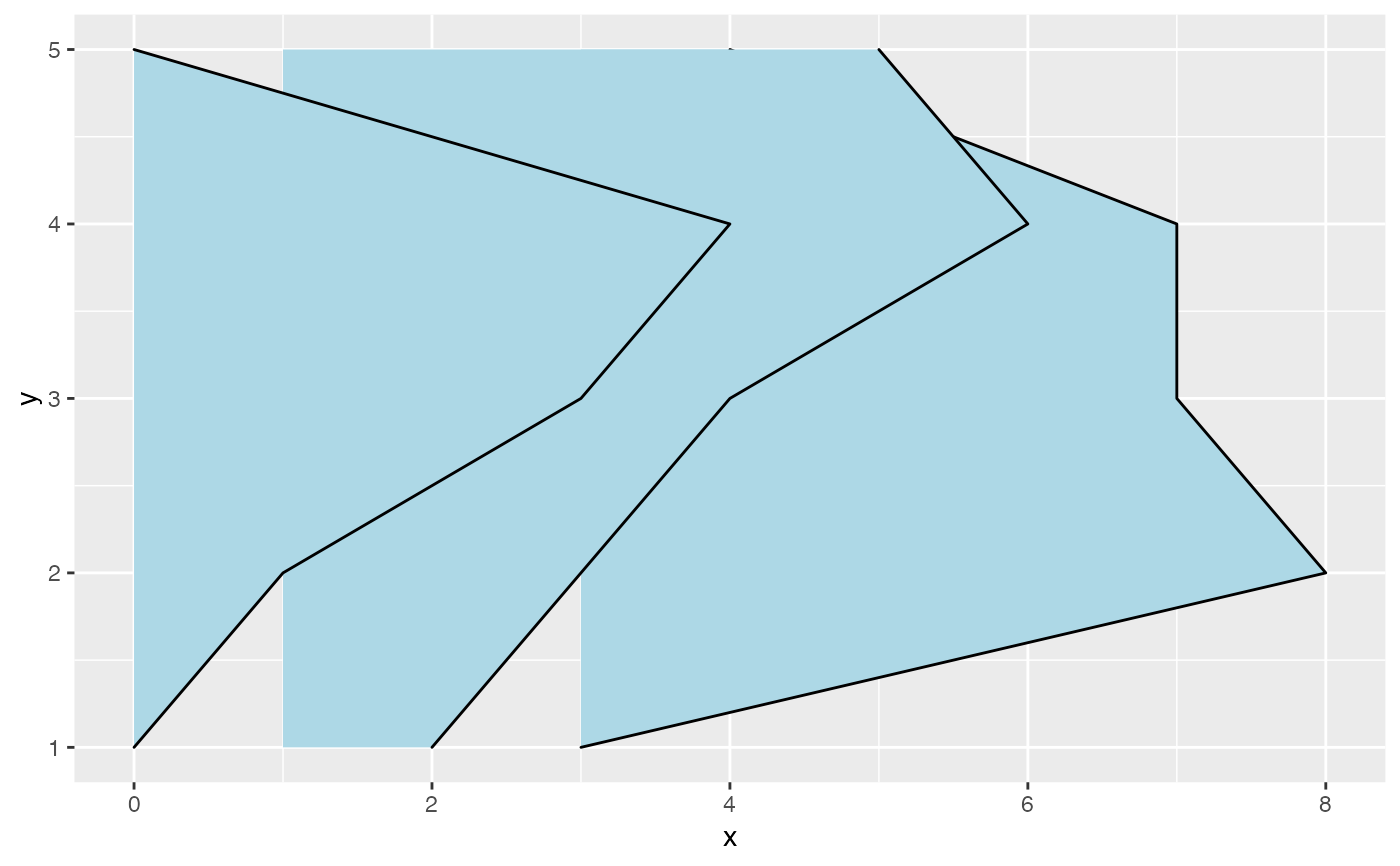
d <- data.frame(y = rep(1:5, 3), x = c(rep(0, 5), rep(1, 5), rep(3, 5)),
width = c(0, 1, 3, 4, 0, 1, 2, 3, 5, 4, 0, 5, 4, 4, 1))
ggplot(d, aes(x, y, width = width, group = x)) + geom_vridgeline(fill="lightblue")
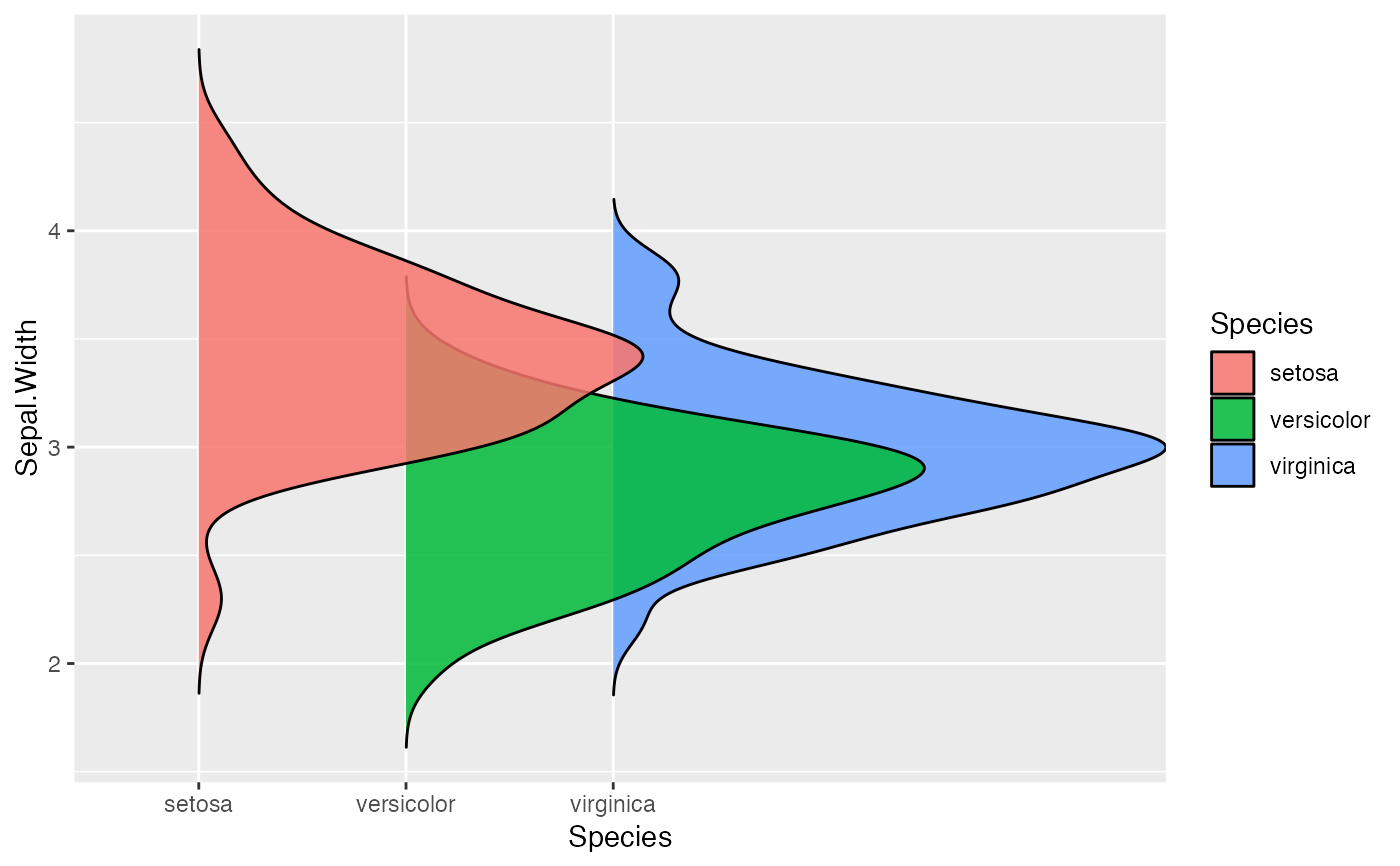
 ggplot(iris, aes(x=Species, y=Sepal.Width, width = after_stat(density), fill=Species)) +
geom_vridgeline(stat="ydensity", trim=FALSE, alpha = 0.85, scale = 2)
ggplot(iris, aes(x=Species, y=Sepal.Width, width = after_stat(density), fill=Species)) +
geom_vridgeline(stat="ydensity", trim=FALSE, alpha = 0.85, scale = 2)