Randomly distribute points in a ridgeline plot between baseline and ridgeline
Source:R/position.R
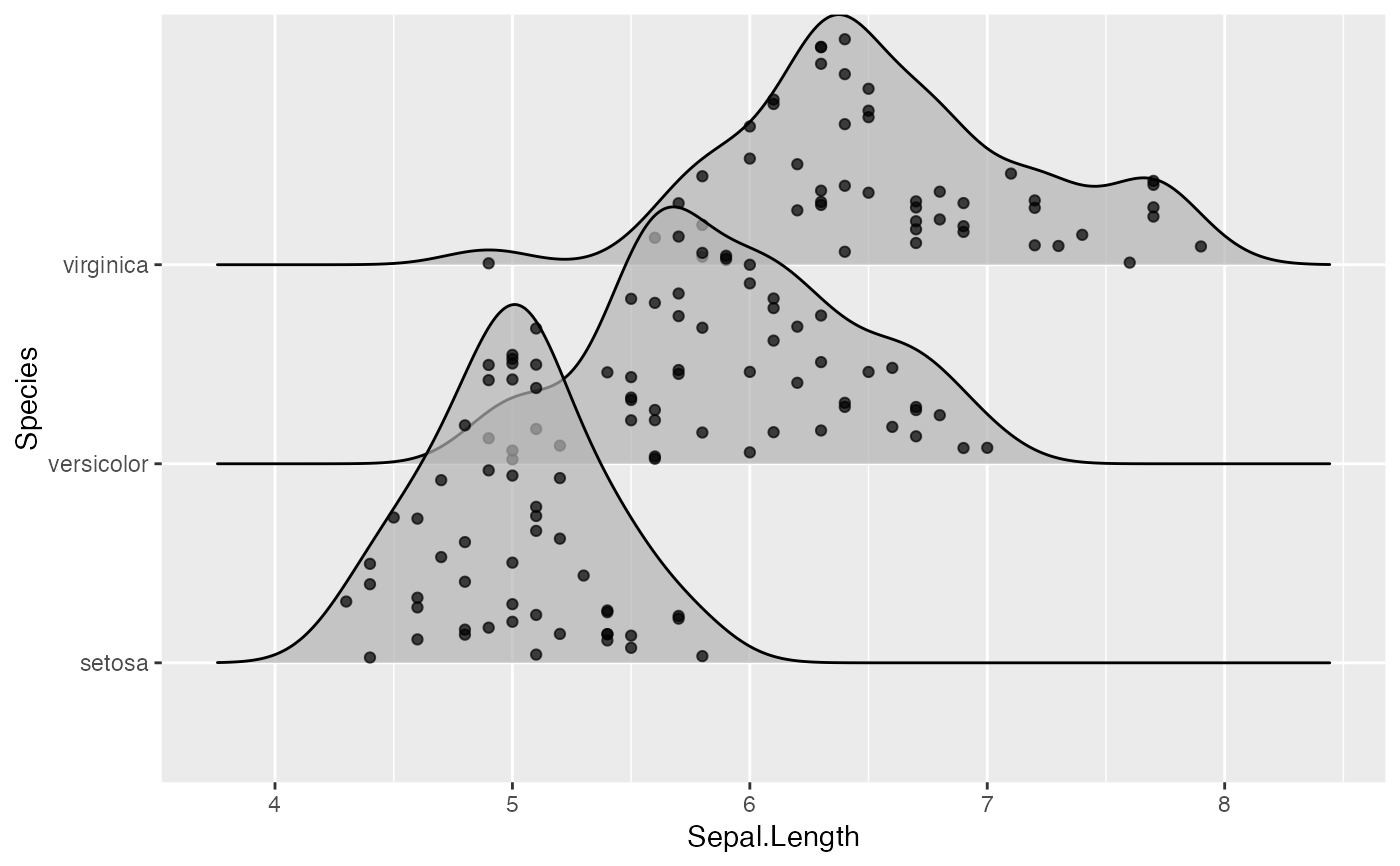
position_points_sina.RdThis is a position adjustment specifically for geom_density_ridges() and related geoms. It
only jitters the points drawn by these geoms, if any. If no points are present, the plot
remains unchanged. The effect is similar to a sina plot: Points are randomly distributed to fill
the entire shaded area representing the data density.
Arguments
See also
Other position adjustments for ridgeline plots: position_points_jitter, position_raincloud
Examples
library(ggplot2)

ggplot(iris, aes(x = Sepal.Length, y = Species)) +
  geom_density_ridges(jittered_points = TRUE, position = "points_sina", alpha = 0.7)
#> Picking joint bandwidth of 0.181