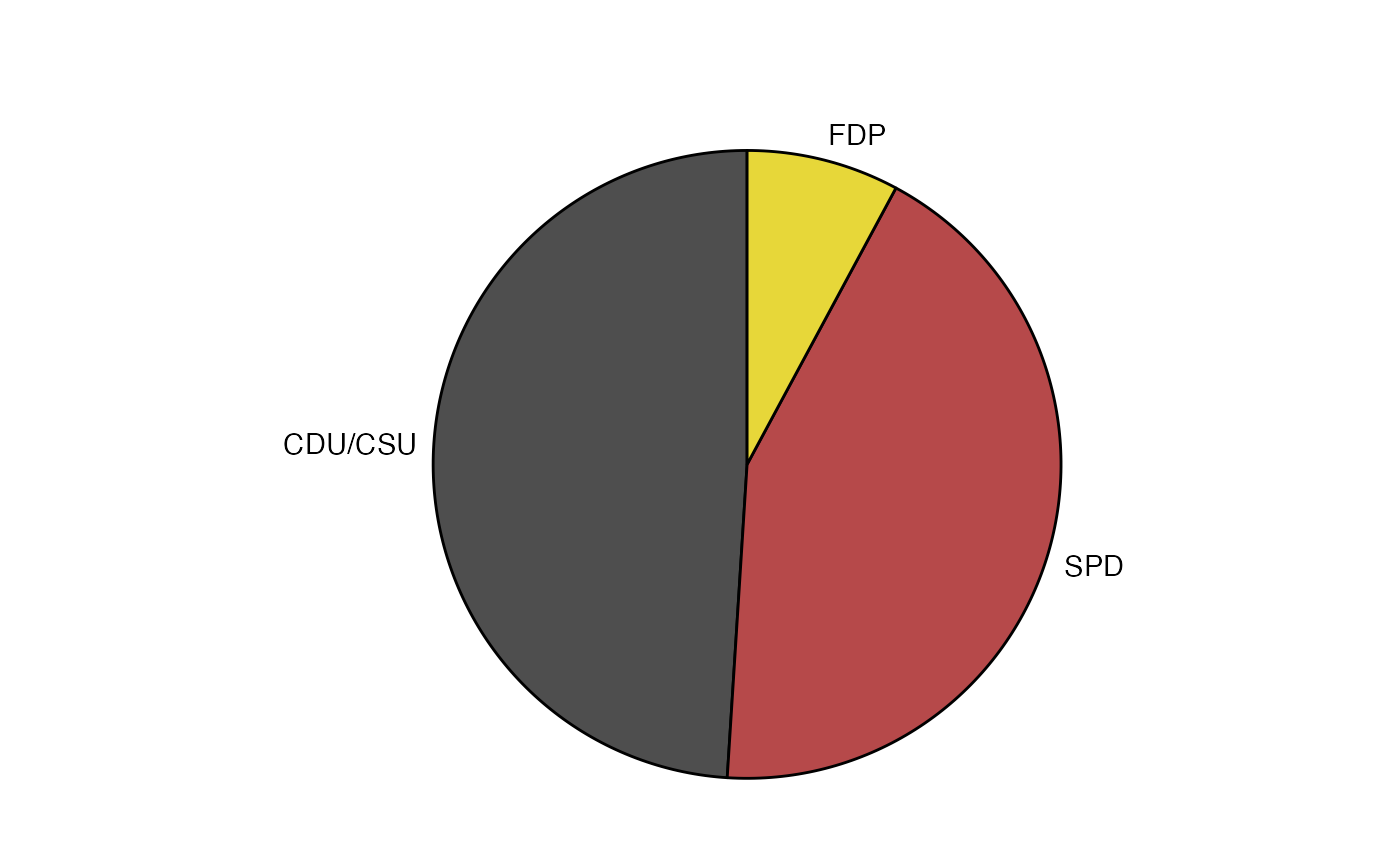
Composition of the 8th Bundestag, from 1976-1980. The party and seat columns should be self-explanatory.
The colors_original column holds the traditional colors used to represent these parties, and the colors
column holds variations of these colors that are less saturated.
bundestag
Format
An object of class tbl_df (inherits from tbl, data.frame) with 3 rows and 4 columns.
References
Source: https://en.wikipedia.org/wiki/Bundestag#Distribution_of_seats_in_the_Bundestag
Examples
#>#> ✓ ggplot2 3.3.3 ✓ purrr 0.3.4 #> ✓ tibble 3.0.6 ✓ dplyr 1.0.3 #> ✓ tidyr 1.1.2 ✓ stringr 1.4.0 #> ✓ readr 1.4.0 ✓ forcats 0.5.1#> Conflicts ────────────────────────────────────────── tidyverse_conflicts() ── #> x dplyr::filter() masks stats::filter() #> x dplyr::lag() masks stats::lag()library(cowplot) library(ggforce) # calculate the start and end angles for each pie bund_pie <- bundestag %>% arrange(seats) %>% mutate( seat_total = sum(seats), end_angle = 2*pi*cumsum(seats)/seat_total, # ending angle for each pie slice start_angle = lag(end_angle, default = 0), # starting angle for each pie slice mid_angle = 0.5*(start_angle + end_angle), # middle of each pie slice, for the text label hjust = ifelse(mid_angle>pi, 1, 0), vjust = ifelse(mid_angle<pi/2 | mid_angle>3*pi/2, 0, 1) ) rpie <- 1 rlabel <- 1.05 * rpie ggplot(bund_pie) + geom_arc_bar( aes( x0 = 0, y0 = 0, r0 = 0, r = rpie, start = start_angle, end = end_angle, fill = colors ) ) + geom_text( aes( x = rlabel*sin(mid_angle), y = rlabel*cos(mid_angle), label = party, hjust = hjust, vjust = vjust ) ) + coord_fixed() + scale_x_continuous(limits = c(-1.6, 1.3), name = NULL, breaks = NULL, labels = NULL) + scale_y_continuous(limits = c(-1.1, 1.3), name = NULL, breaks = NULL, labels = NULL) + scale_fill_identity() + theme_map()