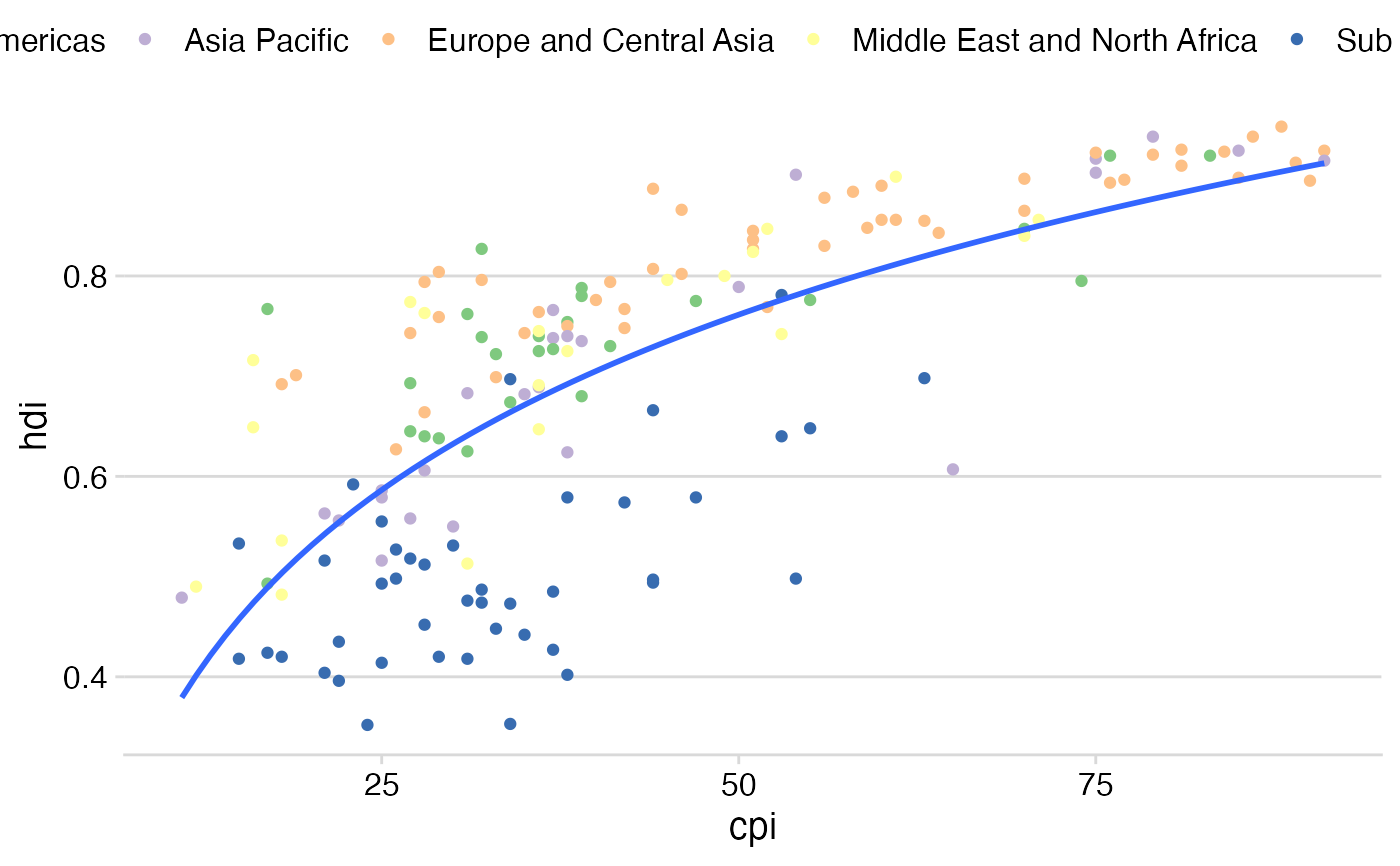
Corruption Perceptions Index (CPI) and Human Development Index (HDI)
Source:R/corruption.R
corruption.RdCorruption Perceptions Index (CPI) and Human Development Index (HDI) for 176 countries, from 2012 to 2015.
corruption
Format
An object of class tbl_df (inherits from tbl, data.frame) with 704 rows and 6 columns.
References
Corruption Perceptions Index: https://www.transparency.org/news/feature/corruption_perceptions_index_2016#table
Human Development Index: http://hdr.undp.org/en/data#
Original figure idea: https://www.economist.com/blogs/dailychart/2011/12/corruption-and-development
Examples
library(tidyverse)
library(cowplot)

corruption %>%
  filter(year == 2015) %>%
  na.omit() %>%
  ggplot(aes(cpi, hdi)) + geom_point(aes(color = region)) +
  geom_smooth(method = 'lm', formula = y~log(x), se = FALSE) +
  scale_color_brewer(name = NULL, type = "qual") +
  theme_minimal_hgrid() +
  theme(legend.position = "top")